SCU Graduating Senior: User Guide and FAQ
A local longitudinal survey designed to measure and assess graduating seniors’ experiences at SCU, including but not limited to: involvement in co-curricular activities, mental health, compassion, sustainability, social entrepreneurship, ethical decision-making, vocation, and Jesuit values. Administered in the spring quarter to all Santa Clara graduating seniors. This survey has replaced the CSS-HERI College Senior Survey.
Submit a Question, Feedback or Request
Please submit your questions, feedback, or requests for additional data via InstitutionalResearch@scu.edu
Frequently Asked Questions
What is the SCU Graduating Senior Survey?
The SCU Graduating Senior Survey is a local longitudinal survey designed to assess graduating seniors’ experiences at SCU, including, but not limited to, involvement in co-curricular activities, mental health, compassion, sustainability, social entrepreneurship, ethical decision-making, vocation, and Jesuit values. Initiated in spring 2023, this survey replaces the CSS-HERI College Senior Survey.
Who is responsible for administering the Senior Survey?
The Office of Institutional Research (IR) is responsible for administering the Senior Survey at Santa Clara University.
Who is surveyed?
For the 2025-2026 academic year, the survey was sent to all undergraduate Fall and Winter term degree completers, and those who petitioned to graduate in the Spring and Summer term.
When is the Senior Survey administered?
The Senior Survey is administered during the Spring quarter of every academic year. The most recent data collection period was mid-May 2026 to mid-June 2026. The next administration is planned for Fall 2026.
The survey is administered through Qualtrics.
Are Senior Survey responses confidential?
Yes. IR links responses for longitudinal tracking and student demographic breakouts. Individual responses are kept confidential and reported only in aggregate. This means your individual answers will not be shared with anyone outside the Office of Institutional Research, and data are reported only as institutional or group-level statistics.
Key Terms
Completions Academic Year
- Refers to class year (e.g., "2024–2025" refers to the "Class of 2025")
- Academic Year: September 1–August 31 (e.g., August 2024 graduates are part of the Class of 2024)
Years
- Filter by year, or select multiple years, to see changes over time and identify trends
Cohort
- For seniors, filter by first-time students vs. transfer students.
- Cohort indicates whether a student entered Santa Clara as a first-time student or transferred in
Sex (Demographic Breakout)
- Break down engagement data by sex (female, male)
First Generation
- Filter by first-generation student status to understand engagement patterns for students whose parents did not earn a four-year college degree
Program of Study (Major)
- Break down data by the students’ major
Survey Questions: Where to Start?
Select different Themes and Constructs to filter question items and explore different facets of student experience.
Themes
The visualization offers a dropdown for Themes that allows you to focus on different aspects of student experience:
- Executive Summary: A high-level overview of key engagement metrics.
- Senior Survey-specific Themes: Focused explorations of particular engagement dimensions, such as Health and Wellness, Meaning and Purpose, Sustainability, and others.
Constructs
Constructs are unobserved qualities like mental health or conscientiousness which are measured by asking a series of relevant questions and generating an overall score.
Constructs on the Senior Survey that are derived from psychometrically validated instruments include:
- Grit items: derived from Grit Scale
- Anxiety, Depression, Wellness items: derived from PROMIS-29+2.
- Compassion items: derived from SCU Brief Compassion Scale
- Ethics items: derived from SCU Ethics Scale
- Vocation items: derived from SCU Vocation Scale
Butler/Purpose items: derived from SWISS Construct of Meaning
Helpful Features
|
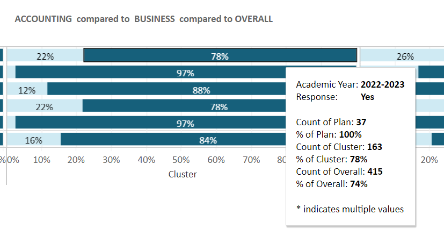
Hover Over Bars to See Details |
 |
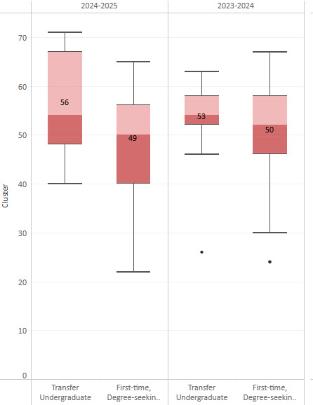
| Reading Box & Whiskers |
|
|
Click to Highlight Specific Data |
 |
|
Filter Data |
 |
|
Response Rate by Plan |
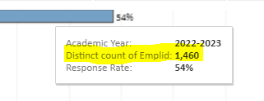
The bar graph will show the percentage of students who responded to the survey. To see the total number surveyed, hover over the bar graph. (In the example below, 1,460 students were surveyed, and 54% responded.)
|
|
Downloading |
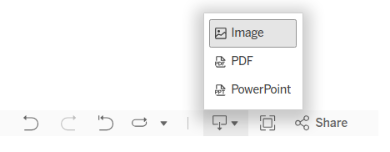
Step 1: Click the Download icon in the bottom right corner.  Step 2: Choose a format to download.
|