This study documents the dramatic decline of riparian habitats along the Salinas River, with particular consequences for the predominantly agricultural and Latino communities of King City and South Salinas. Though comprising just 0.8-2% of western U.S. landscapes, these habitats are ecological lifelines - supporting over half of regional wildlife while providing critical water resources (USDA, 2011) . Our findings reveal a troubling paradox: the very communities maintaining California’s $8 billion agricultural industry face disproportionate environmental burdens, as expanding farmland consumes riparian buffers and contaminates groundwater with nitrates - a crisis prompting Monterey Waterkeeper’s leadership in the Clean Water Coalition.
This study addresses three key research questions:
-
- How has the extent of riparian areas along the Salinas River changed over time?
- How can aerial photography and remotely sensed data sets be leveraged to monitor these changes? and
- Which areas along the Salinas River are most in need of conservation efforts?
As revealed by the analysis of digitized aerial photography and remotely sensed data, the most severe habitat losses (32.6% in King City [1994-2002]; 30.6% in South Salinas [1984-1998]) correlate directly with disappearing green spaces that once provided cooling shade, flood protection, and recreational access for farmworker families. This represents both an ecological crisis and an environmental justice issue - while corporate agriculture profits, frontline communities lose vital natural infrastructure and face heightened exposure to pesticides and water contamination. The remaining riparian corridors, now narrowed by agricultural expansion, represent the last accessible natural spaces for these underserved populations.
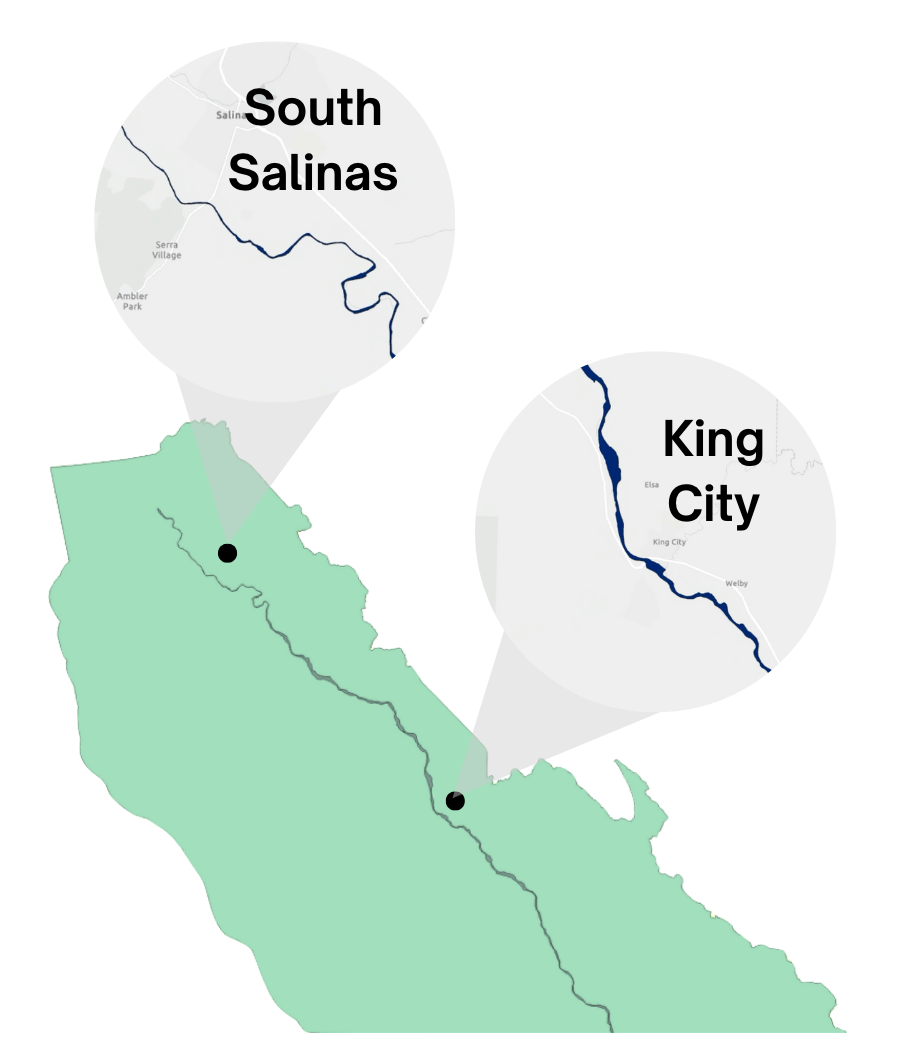
Map of Study Area
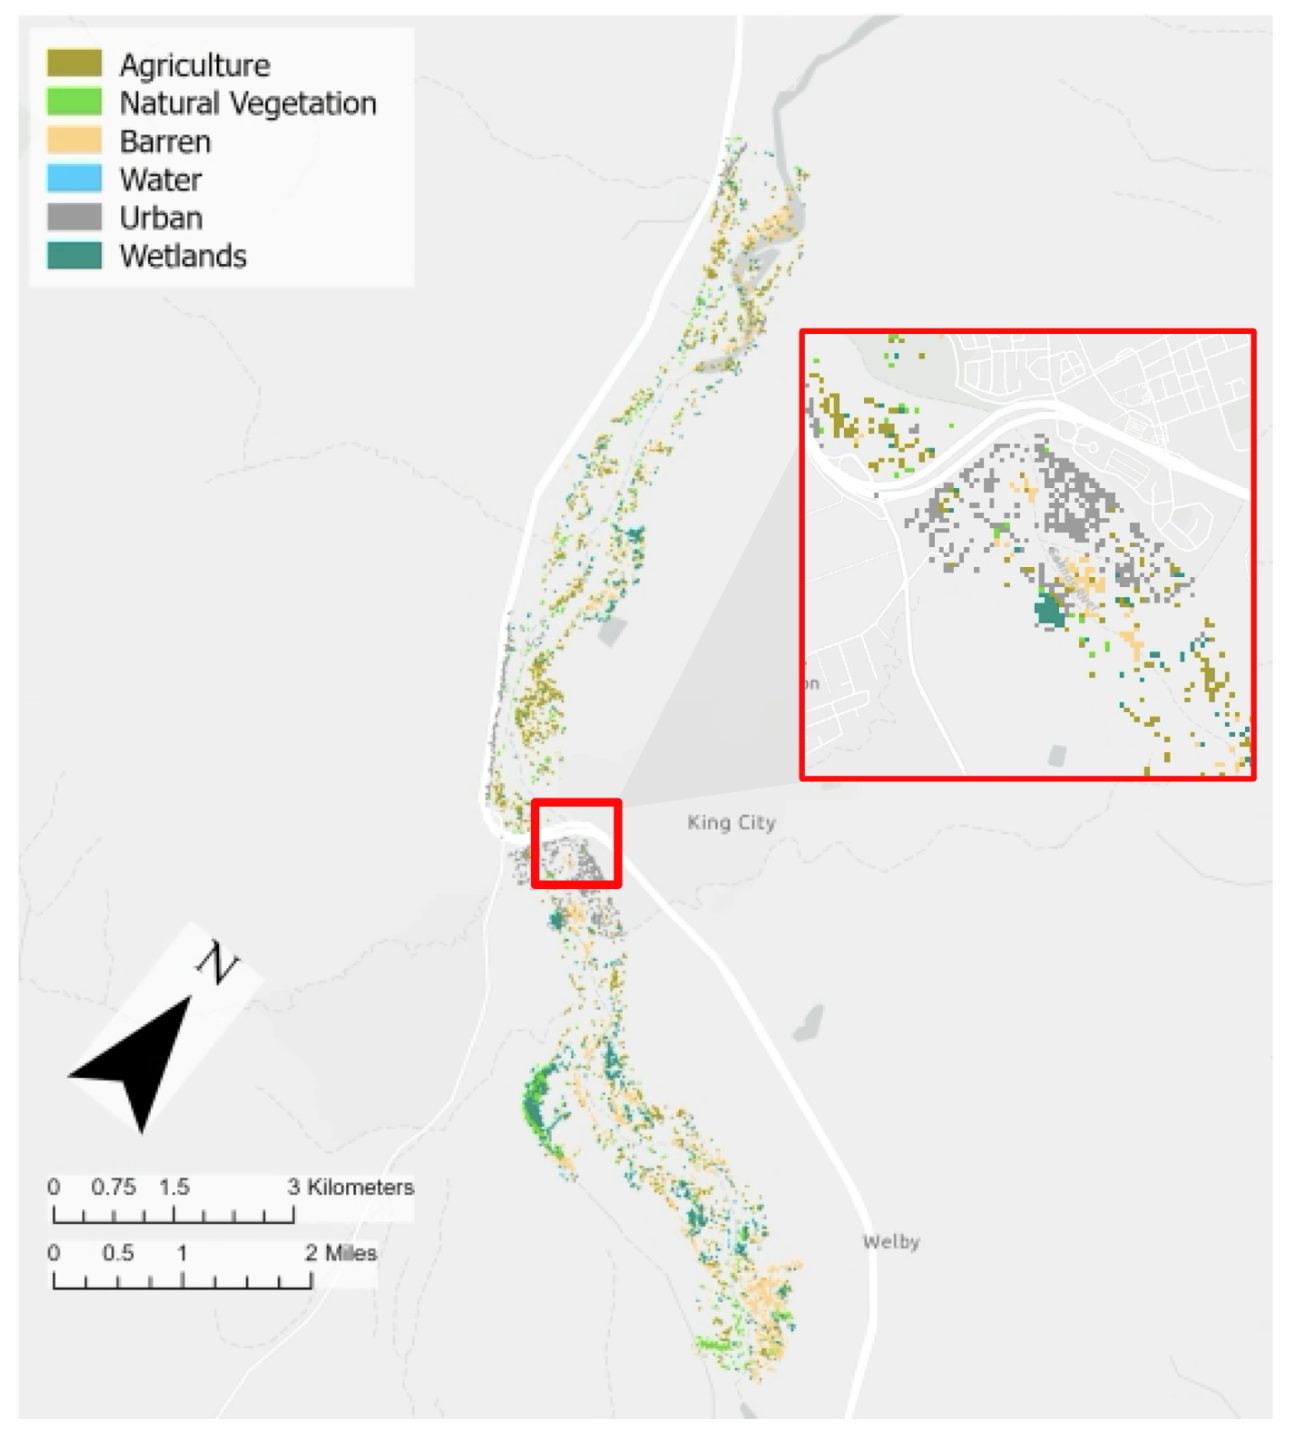
The Land Use Classifications of the Difference in King City Riparian Habitat from 2017 to 2022.
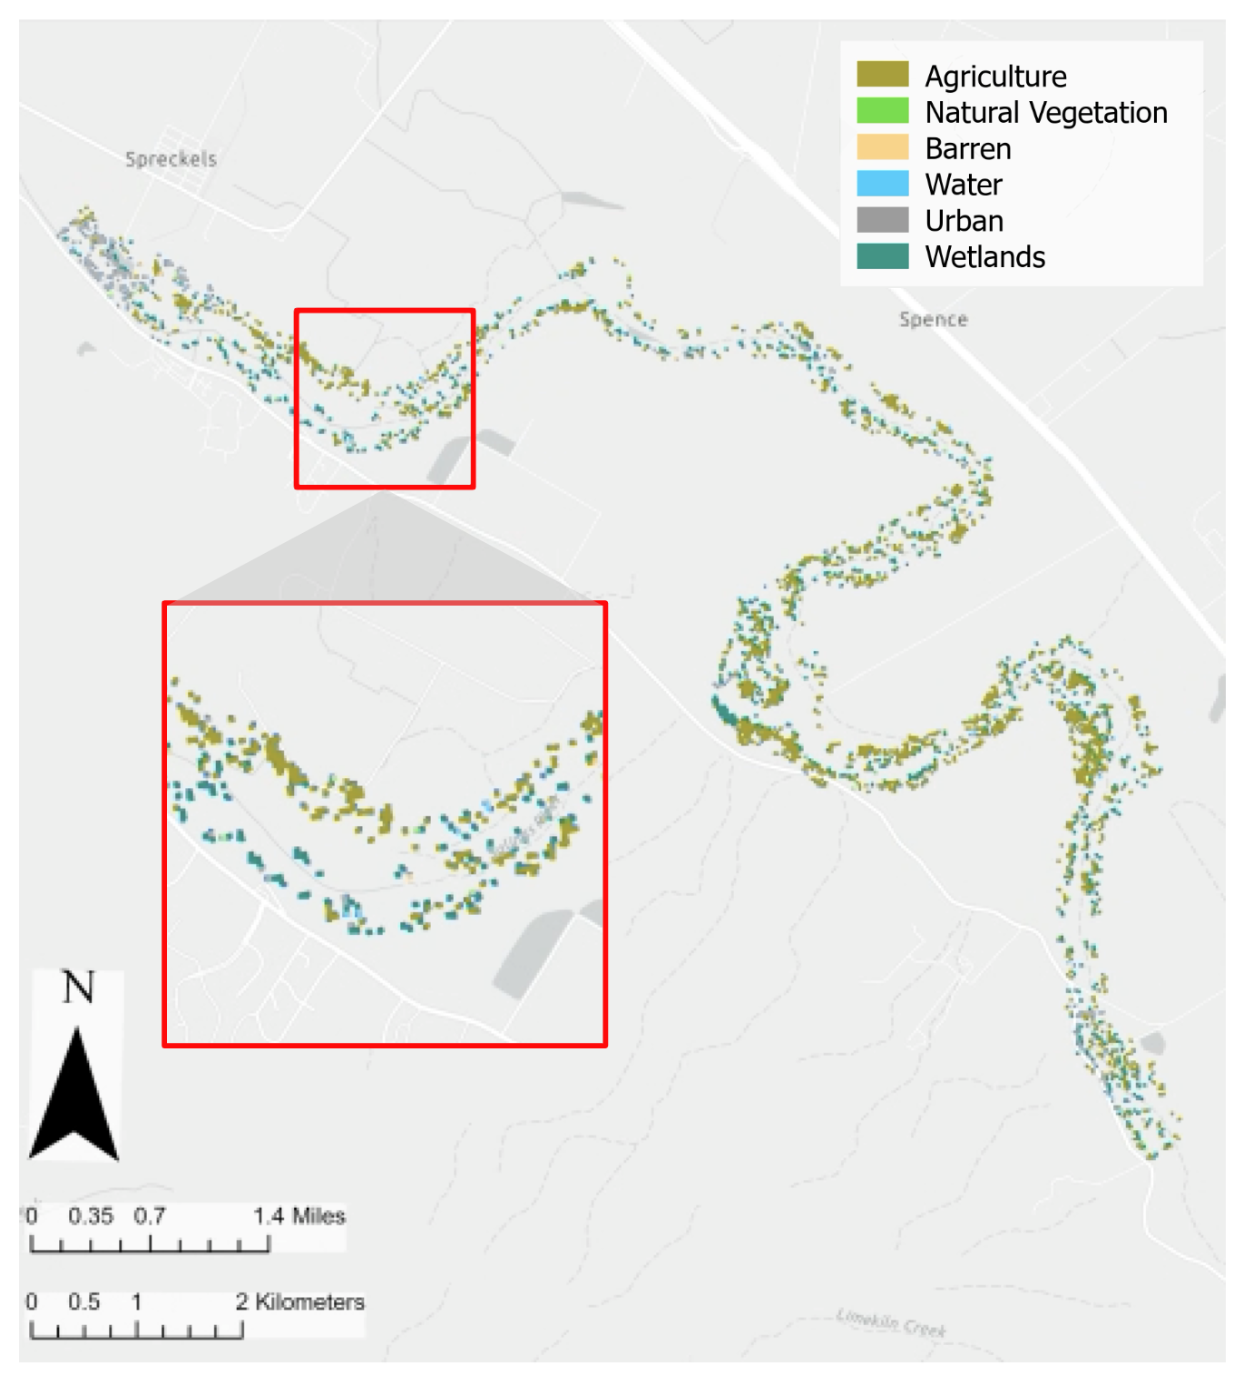
The Land Use Classifications of the Difference in South Salinas Riparian Habitat from 2017 to 2022.
Mapped Changes in Riparian Habitat
It is important to note that the layers of the following maps take varying shapes due to the varying extents of the aerial photographs which were digitized to produce them.
Data layers before 2007 are digitized aerial photographs, while those from 2007 and after are classified LandSat data.
These findings underscore the need for targeted conservation efforts to mitigate further loss. Recommendations include reinforcing riparian boundaries, extending existing habitats to enhance ecological functionality, and fostering collaboration among stakeholders—such as conservation organizations, local governments, and agricultural industries—to establish consistent definitions and management practices.
Student Team: Luke Davidson1, Briana Guingona1, Sophia Harvey1, Ava Pape1
Mentors: Iris Stewart-Frey1, Natalie Herendeen2, Chelsea Tu2
Santa Clara University Department of Environmental Studies and Sciences1, Monterey Waterkeeper2
References