EJ in Disadvantaged Communities
Our Motivation
Much of the Central Valley relies on agriculture and dairy farming. Additionally, much of the region is considered a disadvantaged community (<80% of statewide median income), or severely disadvantaged community (<60% of statewide median income) with limited access to resources and an inequitable burden to climate justice issues including extreme heat, poor air quality, and contaminated drinking water. The state of California has developed several programs such as The Nitrate Control Program (NCP) adopted in May 2018 by the Central Valley Regional Water Quality Control Board (Central Valley Water Board) to ensure compliance with groundwater discharge regulations regarding nitrates. One of the first steps of the NCP was the development of the six highest-priority groundwater basins, two of which are Modesto and Turlock. The Valley Water Collaborative (VWC) was created in 2020 to address nitrate contamination of groundwater in private domestic wells and provide safe drinking water to residents who use these wells for their drinking water within Modesto and Turlock. The state has also introduced a Climate Action Plan in 2022 entitled Protecting Californians From Extreme Heat: A State Action Plan to Build Community Resilience to mitigate extreme heat that disproportionality impacts low-income communities and communities of color that are often synonymous with disadvantaged communities by increasing community services like cooling centers, increasing resilience of the built environment, and utilize nature-based solutions. Additionally, Assembly Bill 2238 and Senate Bill 306 have been introduced to mitigate extreme heat across California. Despite all of the programs in place disadvantaged communities throughout the state still share an unequal burden of environmental burdens of poor air quality, water contamination, and extreme heat.
Our Approach
We analyzed three different definitions of disadvantaged communities (two at the state level and one at the federal level) to map the distribution of commutes under disadvantaged status and compared them to exposure to environmental injustices/hazards, namely groundwater contaminants, exposure to extreme heat, and access to shade. We also used well water contaminant levels (Nitrate, Arsenic, and 1, 2, 3 TCP,) from the California State Water Board and used an interpolation technique to map areas spatially between sample points. The well data was sampled from September 30th, 2009 (the start of the 2010 water year) to December 1st, 2023, and averaged to unique reading per year and then the yearly averages were averaged to one reading for interpolation. We then compared the distribution of areas above the MCL for each contaminant and measured the total area of disadvantaged communities impacted under the three definitions of Disadvantaged communities (DWT: Drinking Water Tool) which relies uses average median household income (MHI) of less than 80% of California’s overall MHI, and also has a designation of severely disadvantaged community (SDAC) is one with an average MHI of less than 60% of California’s overall MHI, CalEnviroScreen is another metric used which considers a DAC to be a neighborhood scoring in the top 25th percentile of their aggregate CES score which include pollution burdens such as Pesticide use, groundwater threats , and PM 2.5 concentrations and population characteristics such as poverty, linguistic isolation and housing burdeen, and Climate and Economic Justice Tool where communities are identified as disadvantaged if they are in census tracts that: ARE at or above the 90th percentile for expected agriculture loss rate OR expected building loss rate OR expected population loss rate OR projected flood risk OR projected wildfire risk AND are at or above the 65th percentile for low income.
We plan on expanding our work to include air quality data for ozone, PM 2.5, and PM 10. We also plan to expand our analysis beyond the case study regions of Modesto, Turlock, and Fresno in the Central Valley.
Our Results
The spatial extent of communities with disadvantaged status varied widely based on the three definitions/methodologies. Using Stanislaus and Merced Counties as a case study we found that unsafe nitrate levels were present in over 20% of disadvantaged communities for all definitions of disadvantaged and over 30% of disadvantaged communities based on the federal Climate and Economic Justice Tool. Unsafe levels of arsenic were found in over 10% of disadvantaged communities based on all three definitions and up to 21% of communities based on the federal Climate and Economic Justice Tool. Unsafe levels of 1,2,3 of TCP were present in 56% of communities based on the Drinking Water Tool, 46% of communities based on the Calenviroscreen definition, and 30% of disadvantaged communities based on the federal Climate and Economic Justice Tool. In addition, 1, 2, 3 TCP had by far the lowest MCL with a safe limit being reported at just 0.005 μg/L or 0.000005 mg/L. There were also far fewer measurements available (4,319 between 2010 and 2023 spread between Municipal (4,211), and Domestic (108)). The disadvantaged Hilmar located just south of the Merced/Stanislaus county border has groundwater contaminants of Nitrate, Arsenic, and 1, 2, 3 TCP above the maximum contaminant level.
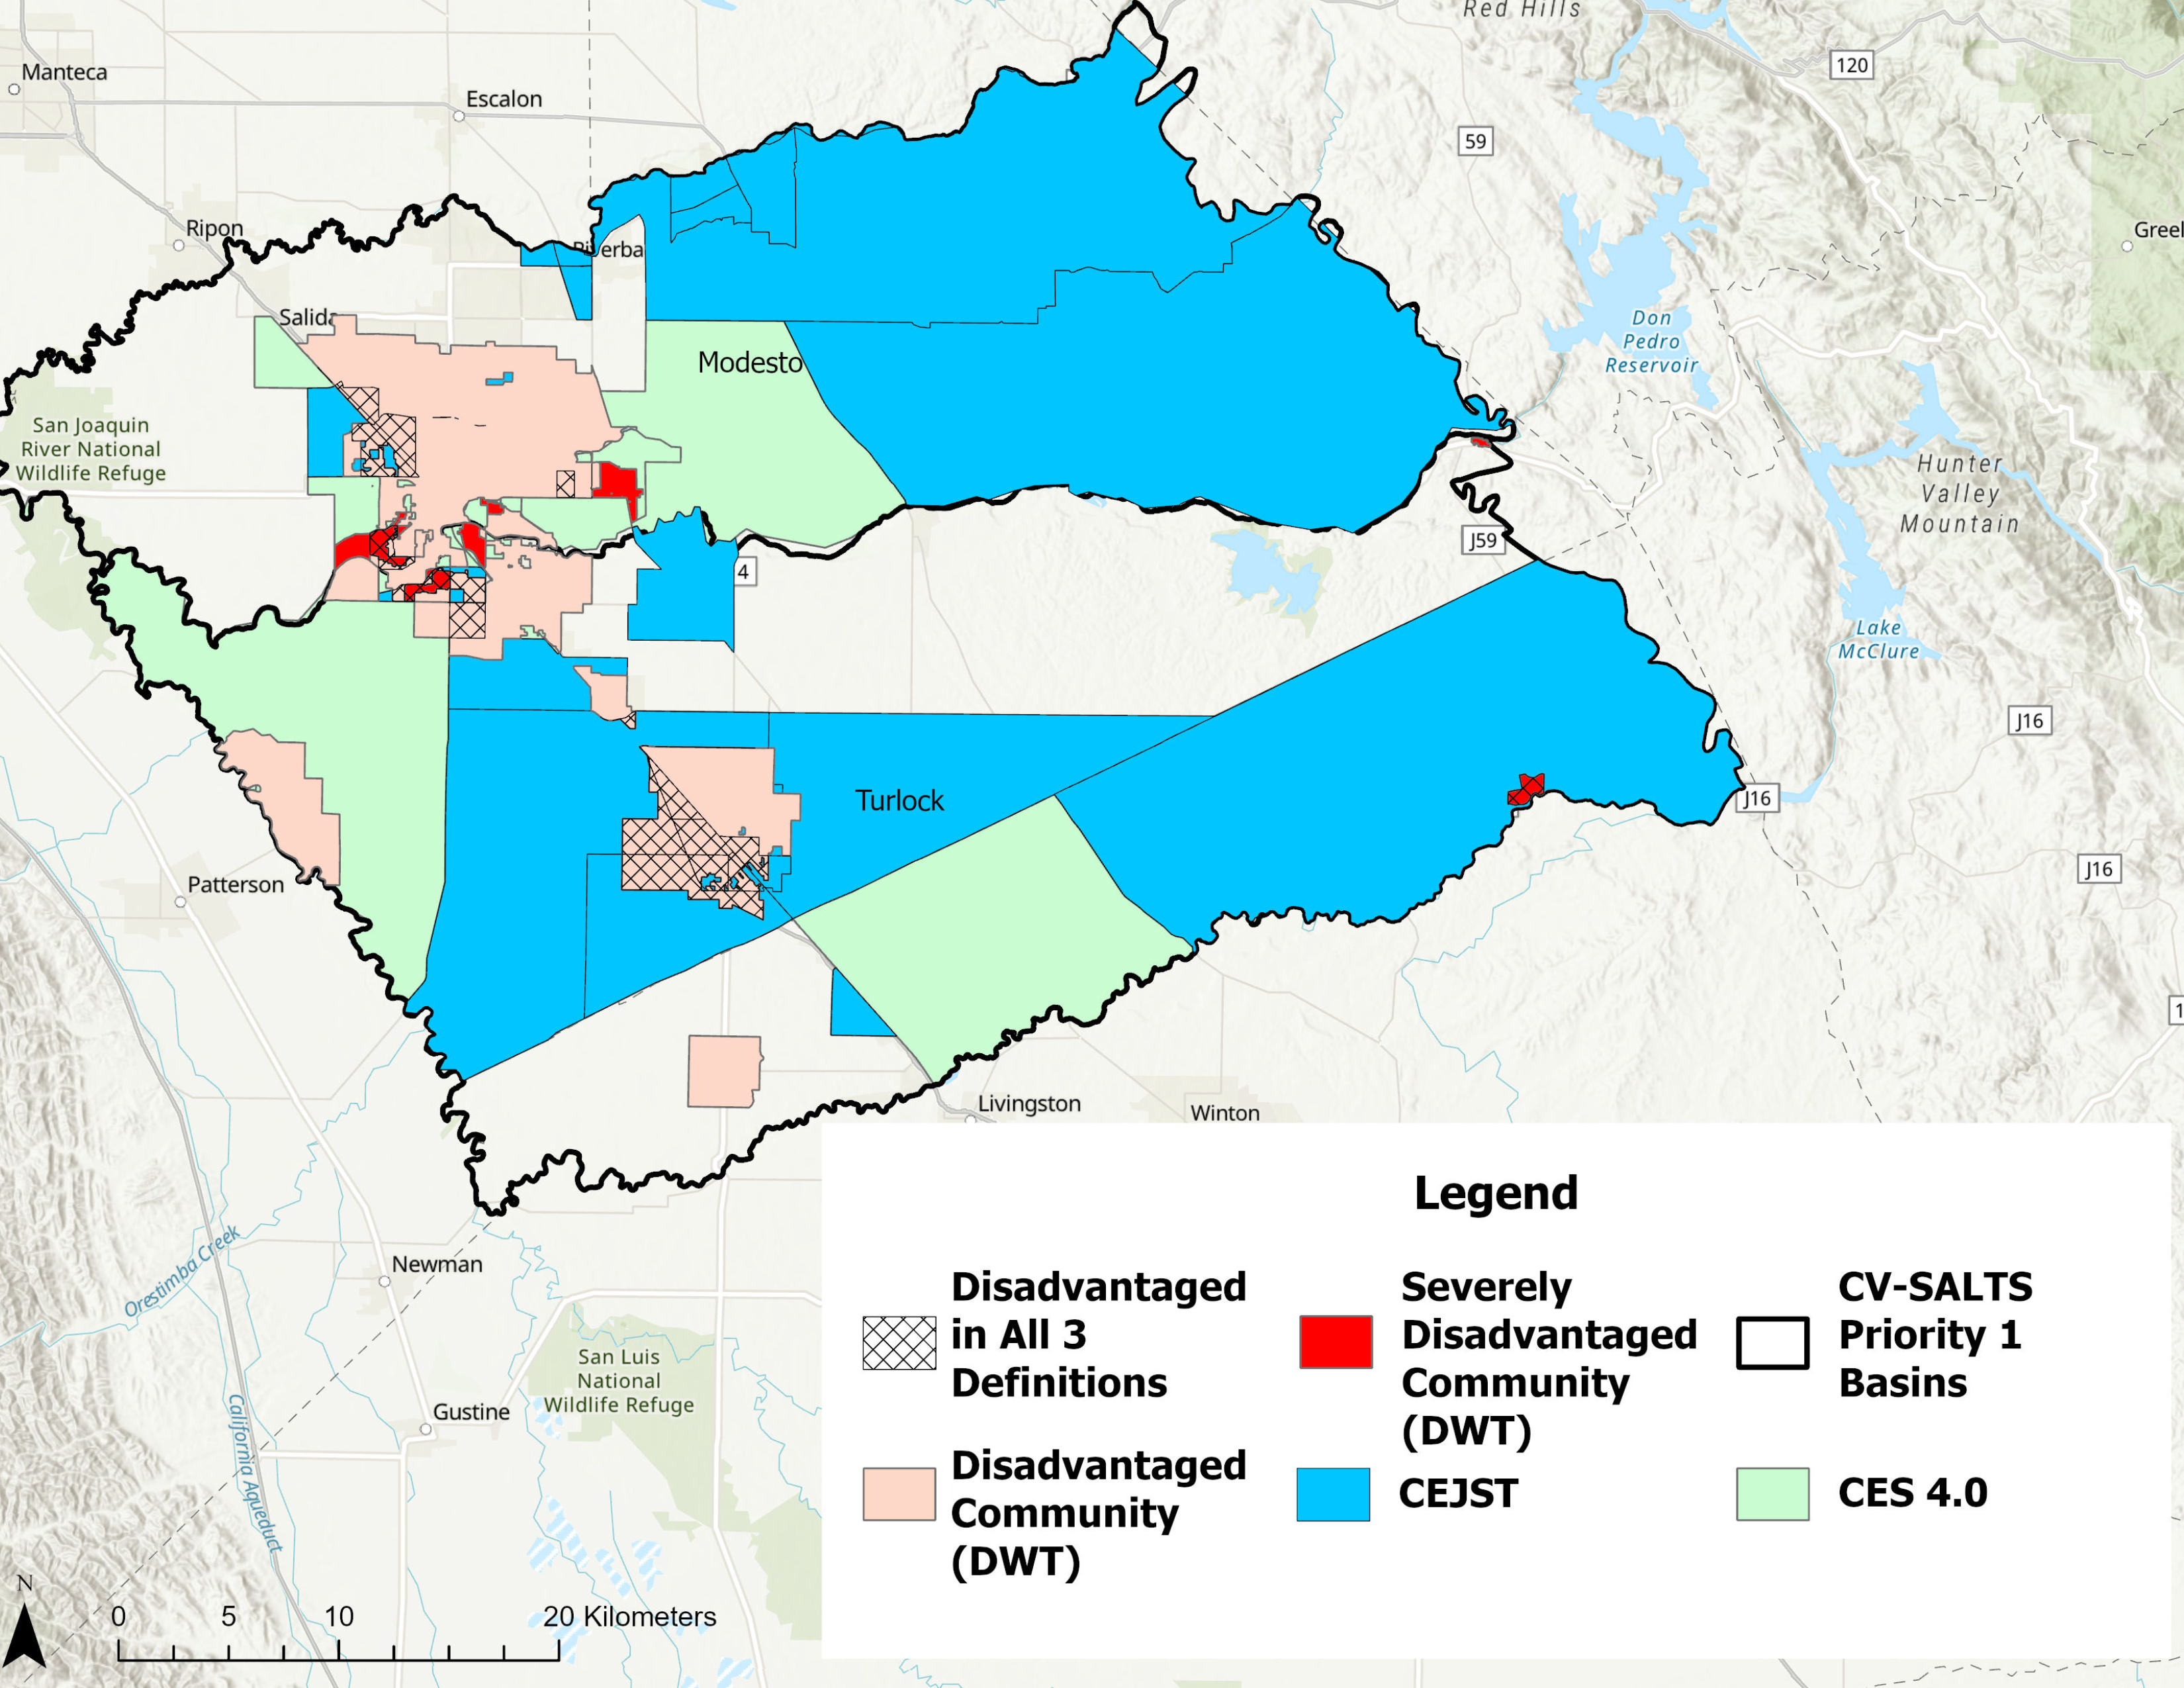
Designations of Disadvantaged Communities in Stanislaus and Merced Counties
Variation of the spatial extent of disadvantaged communities based on the state-level definitions of disadvantaged (Drinking Water Tool and Calenviroscreen), and a Federal level definition (Federal Climate and Economic Justice Tool)
Figure by Jake Dialesandro, Sarah Movahedi, and Iris Stewart-Frey.
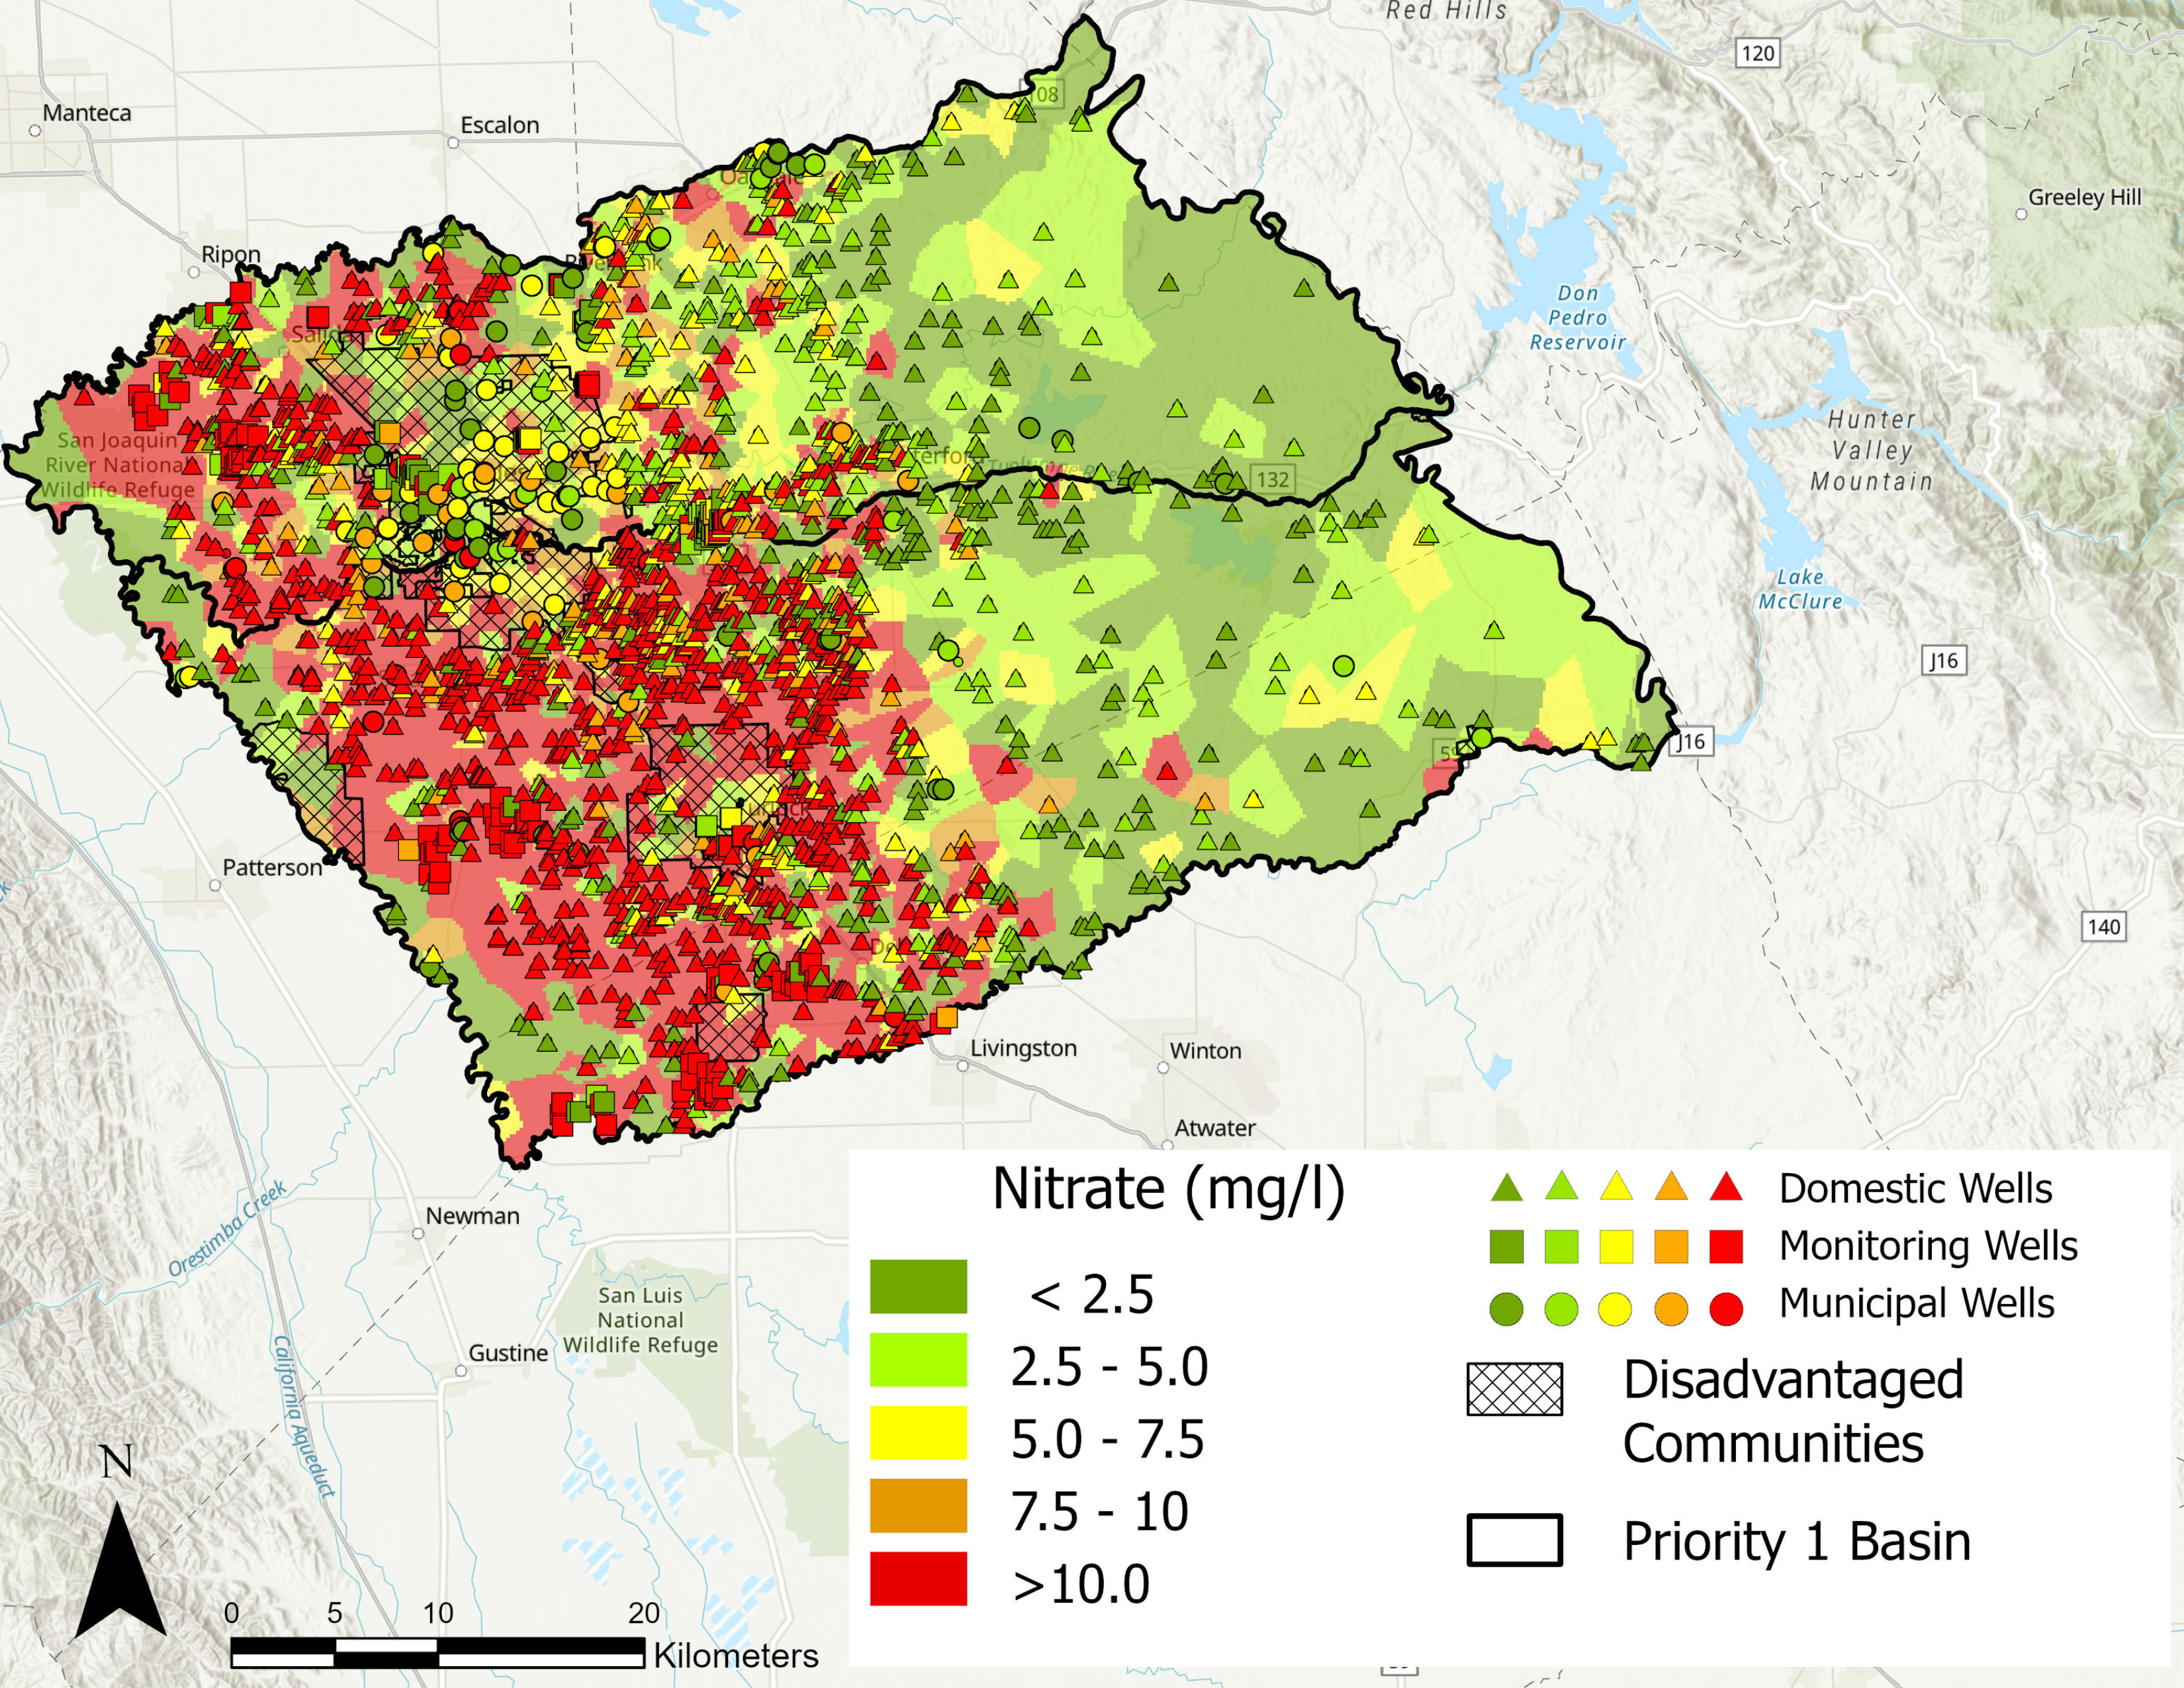
Nitrate Levels Throughout Stanislaus and Merced Counties vs. Locations of Disadvantaged Communities
Interpolated Groundwater Nitrate Contamination in Stanislaus and Merced Counties, together with nitrate concentrations in domestic, monitoring, and municipal wells and the location of disadvantaged communities. Widespread nitrate concentrations above safe levels are found in the southwestern area of Stanislaus and Merced Counties, near disadvantaged communities, including Hilmar, California.
Figure by Iris Stewart-Frey, Jake Dialesandro, and Lilah Foster.
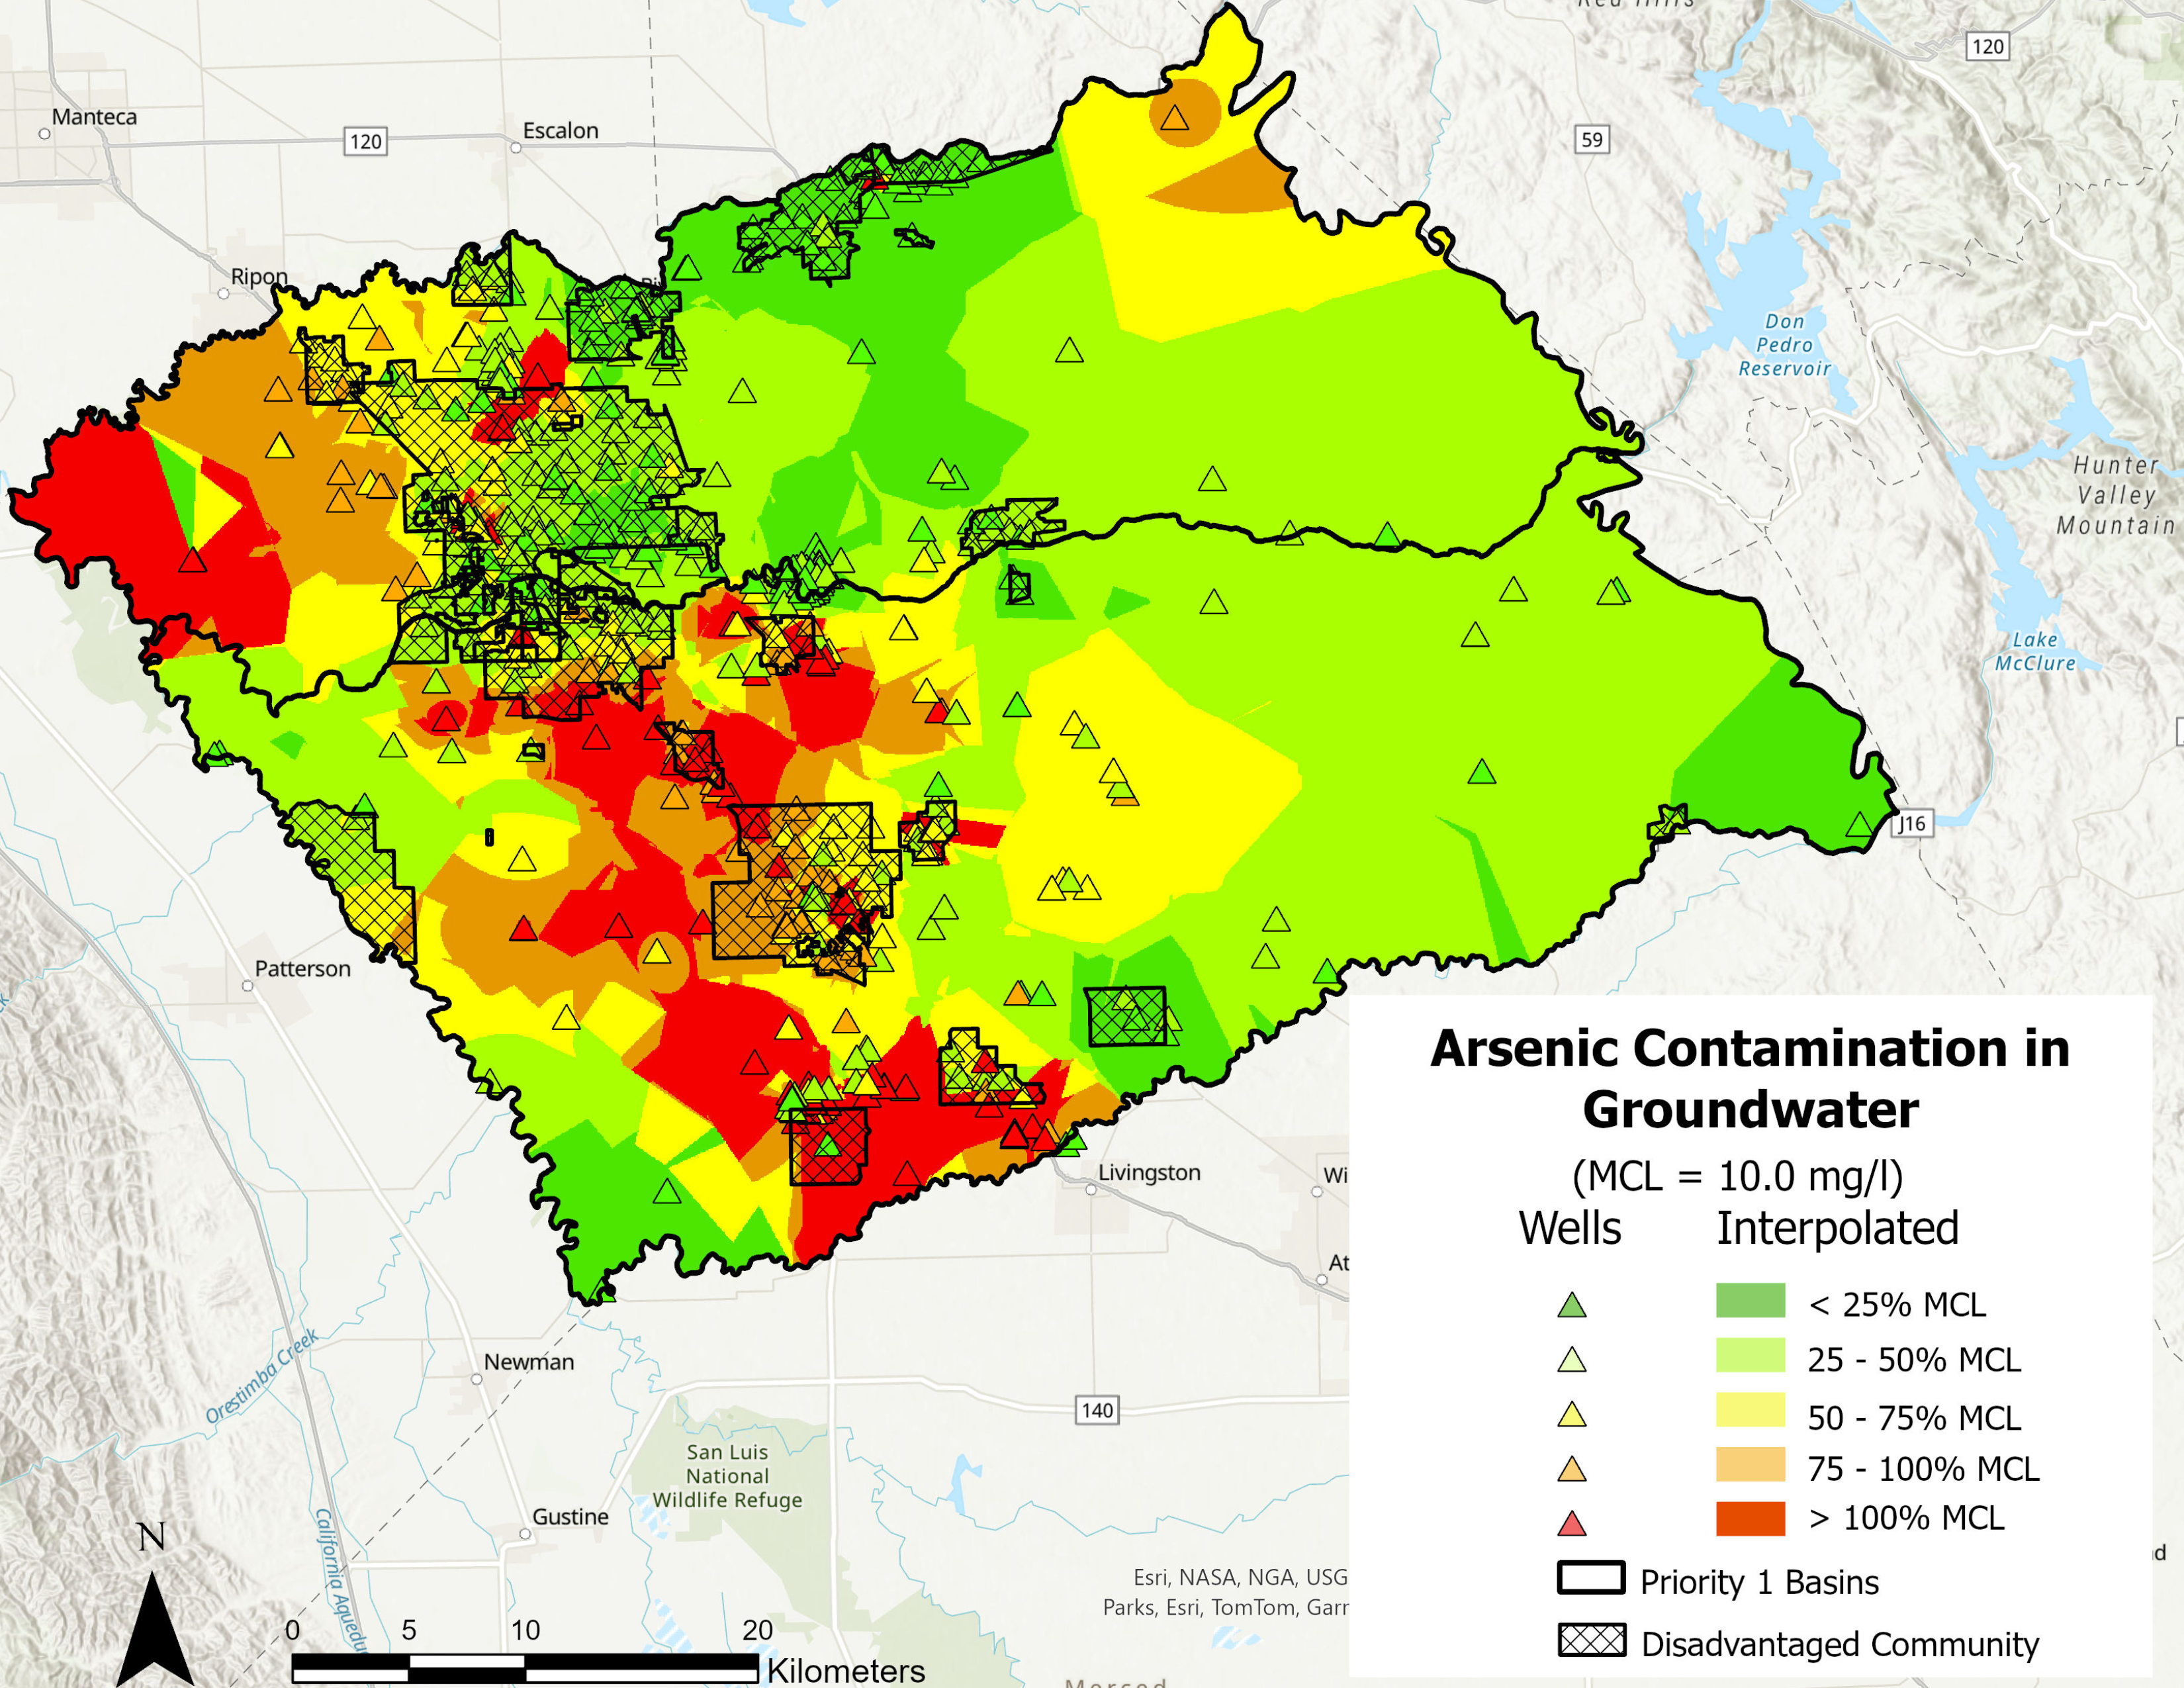
Arsenic Groundwater Contamination
In comparison to nitrate and 1, 2, 3 TCP, there was less of a spatial extent of groundwater above the Maximum Contaminant Level (10ug/l). The locations with consistent levels above the MCL were in northern Merced Counties near the disadvantaged communities of Hilmar and Delhi, California.
Figure by Jake Dialesandro, Iris Stewart-Frey, and Sarah Movahedi.
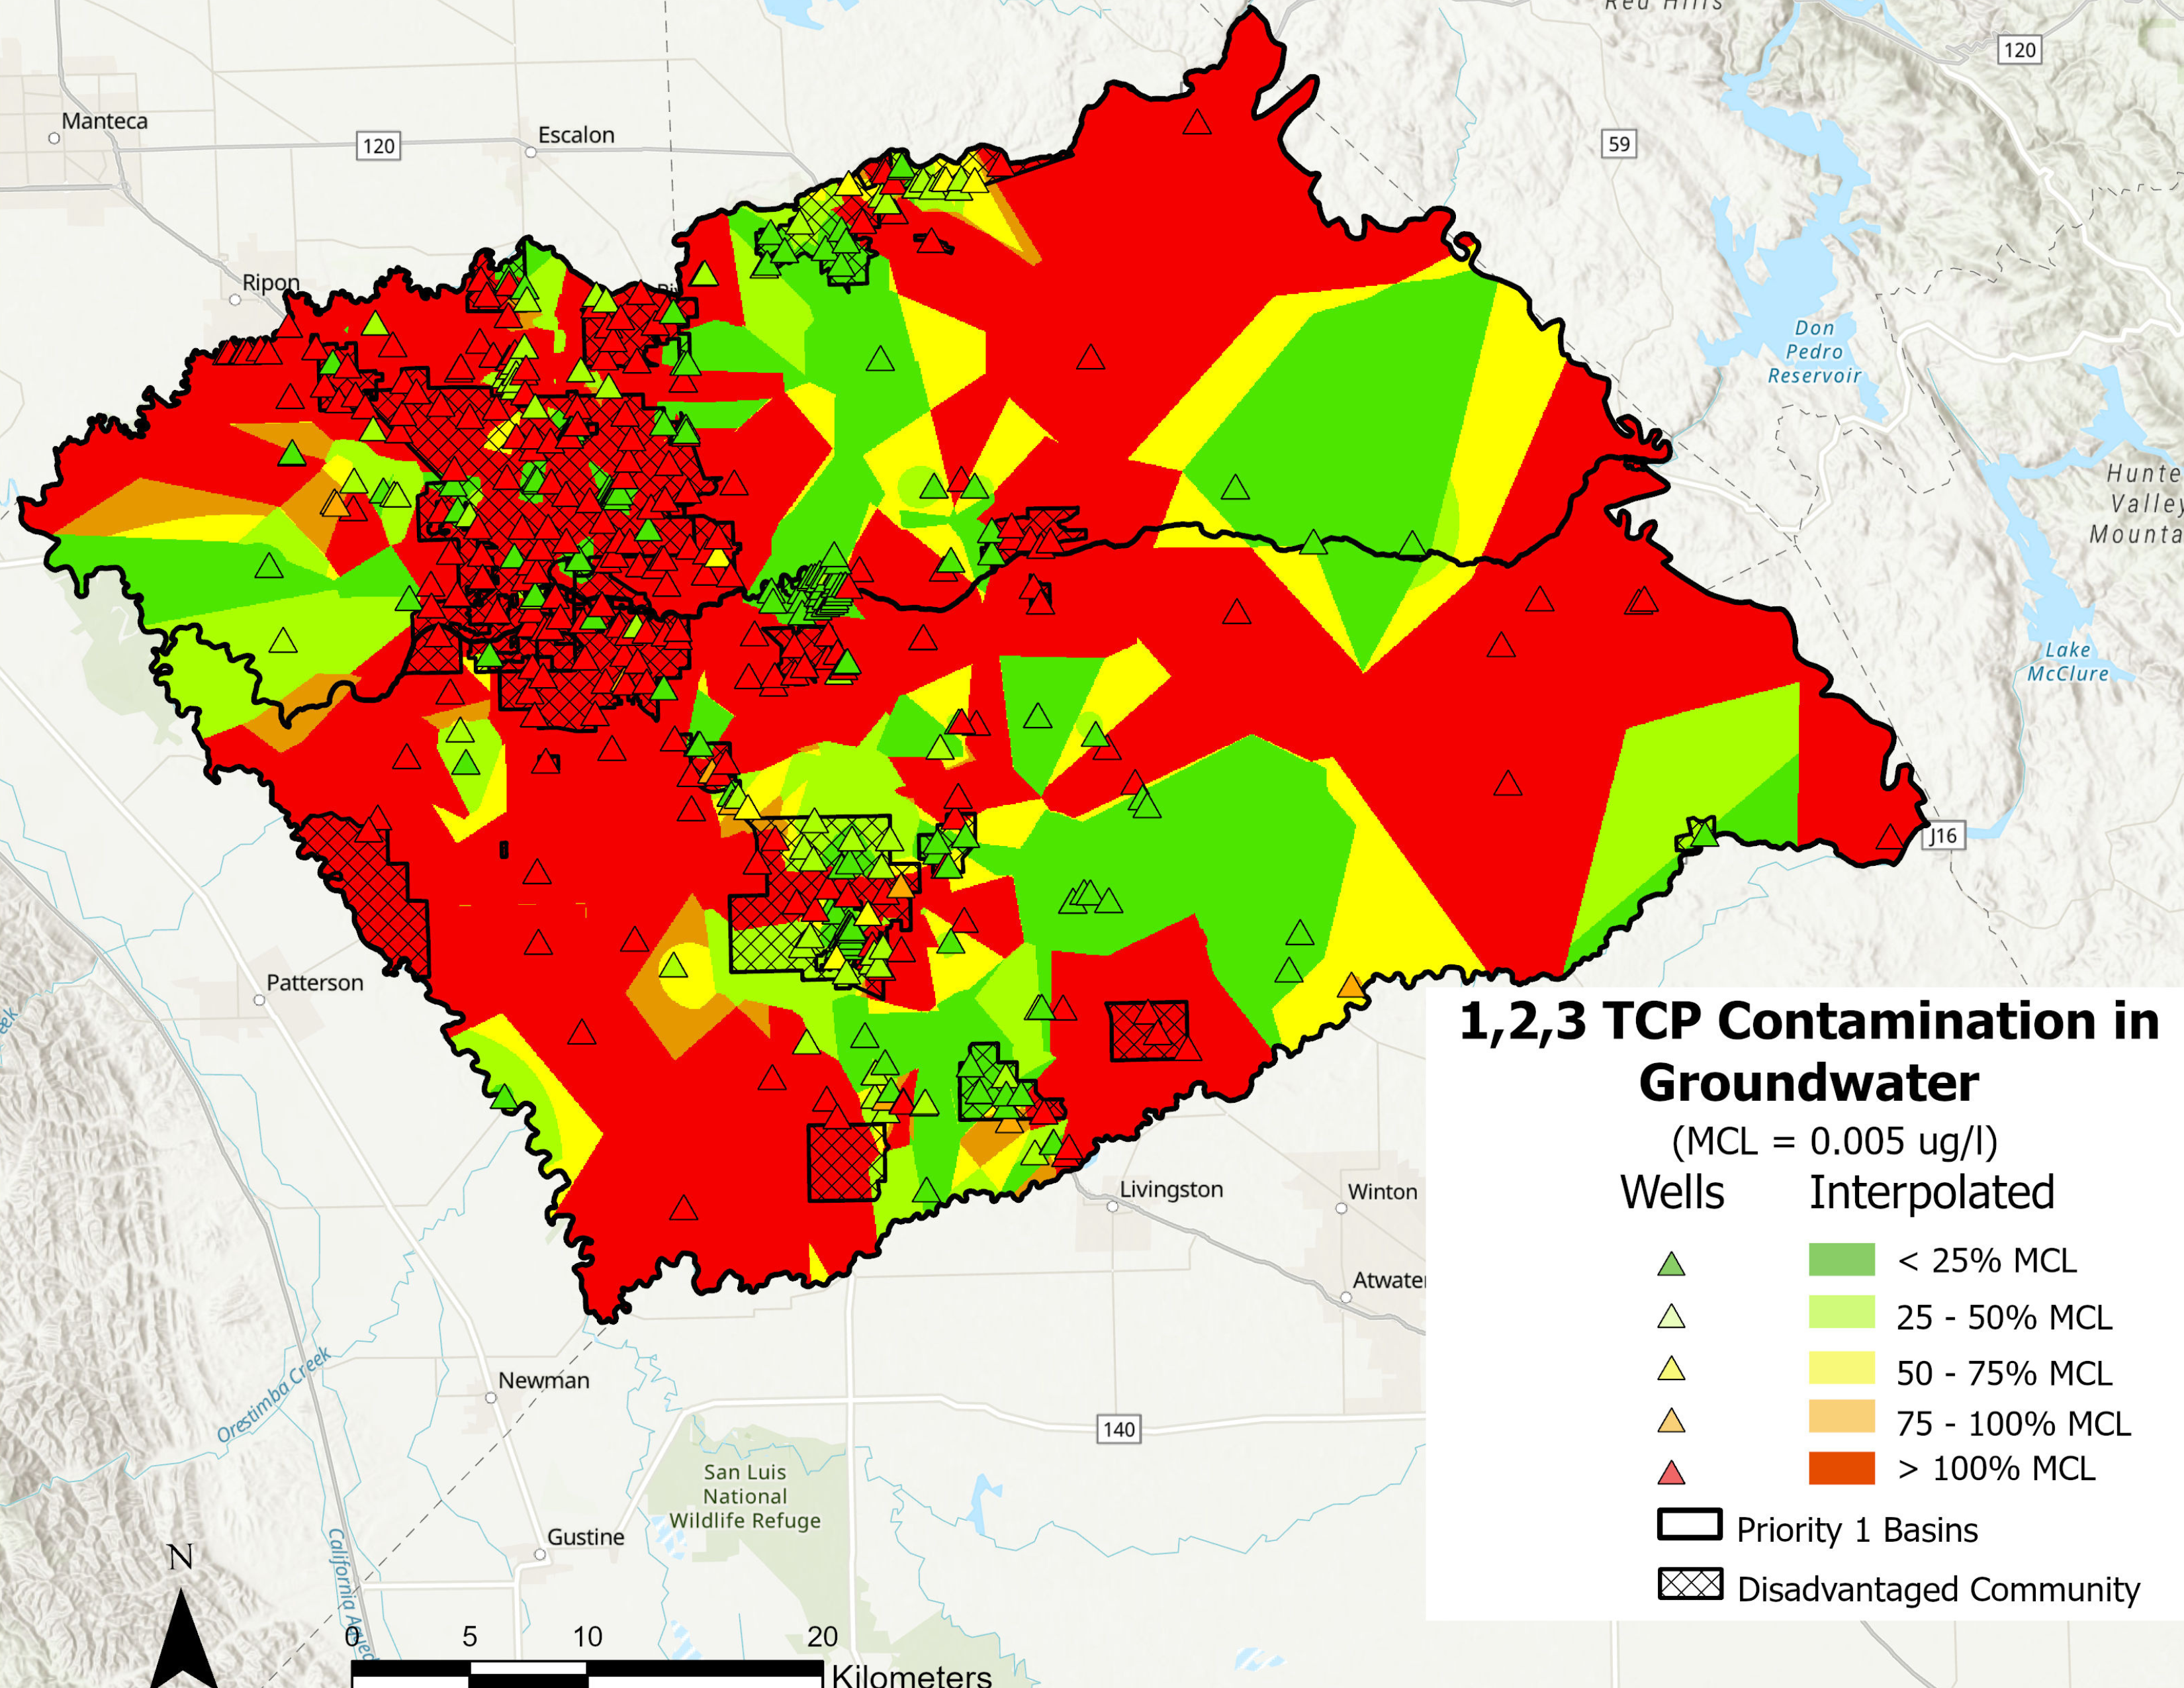
1, 2, 3 TCP Groundwater Contamination 2010-2023
1, 2, 3 TCP groundwater levels above the MCL (0.005ug/l) were extensive across the entire study area with many urbanized areas also having high levels of 1, 2, 3 TCP. Over 50% of areas within disadvantaged communities had groundwater contamination levels above the MCL. Additionally, over 60% of shallow wells had measurements above the MCL.
Figure by Jake Dialesandro, Iris Stewart-Frey, and Sarah Movahedi.
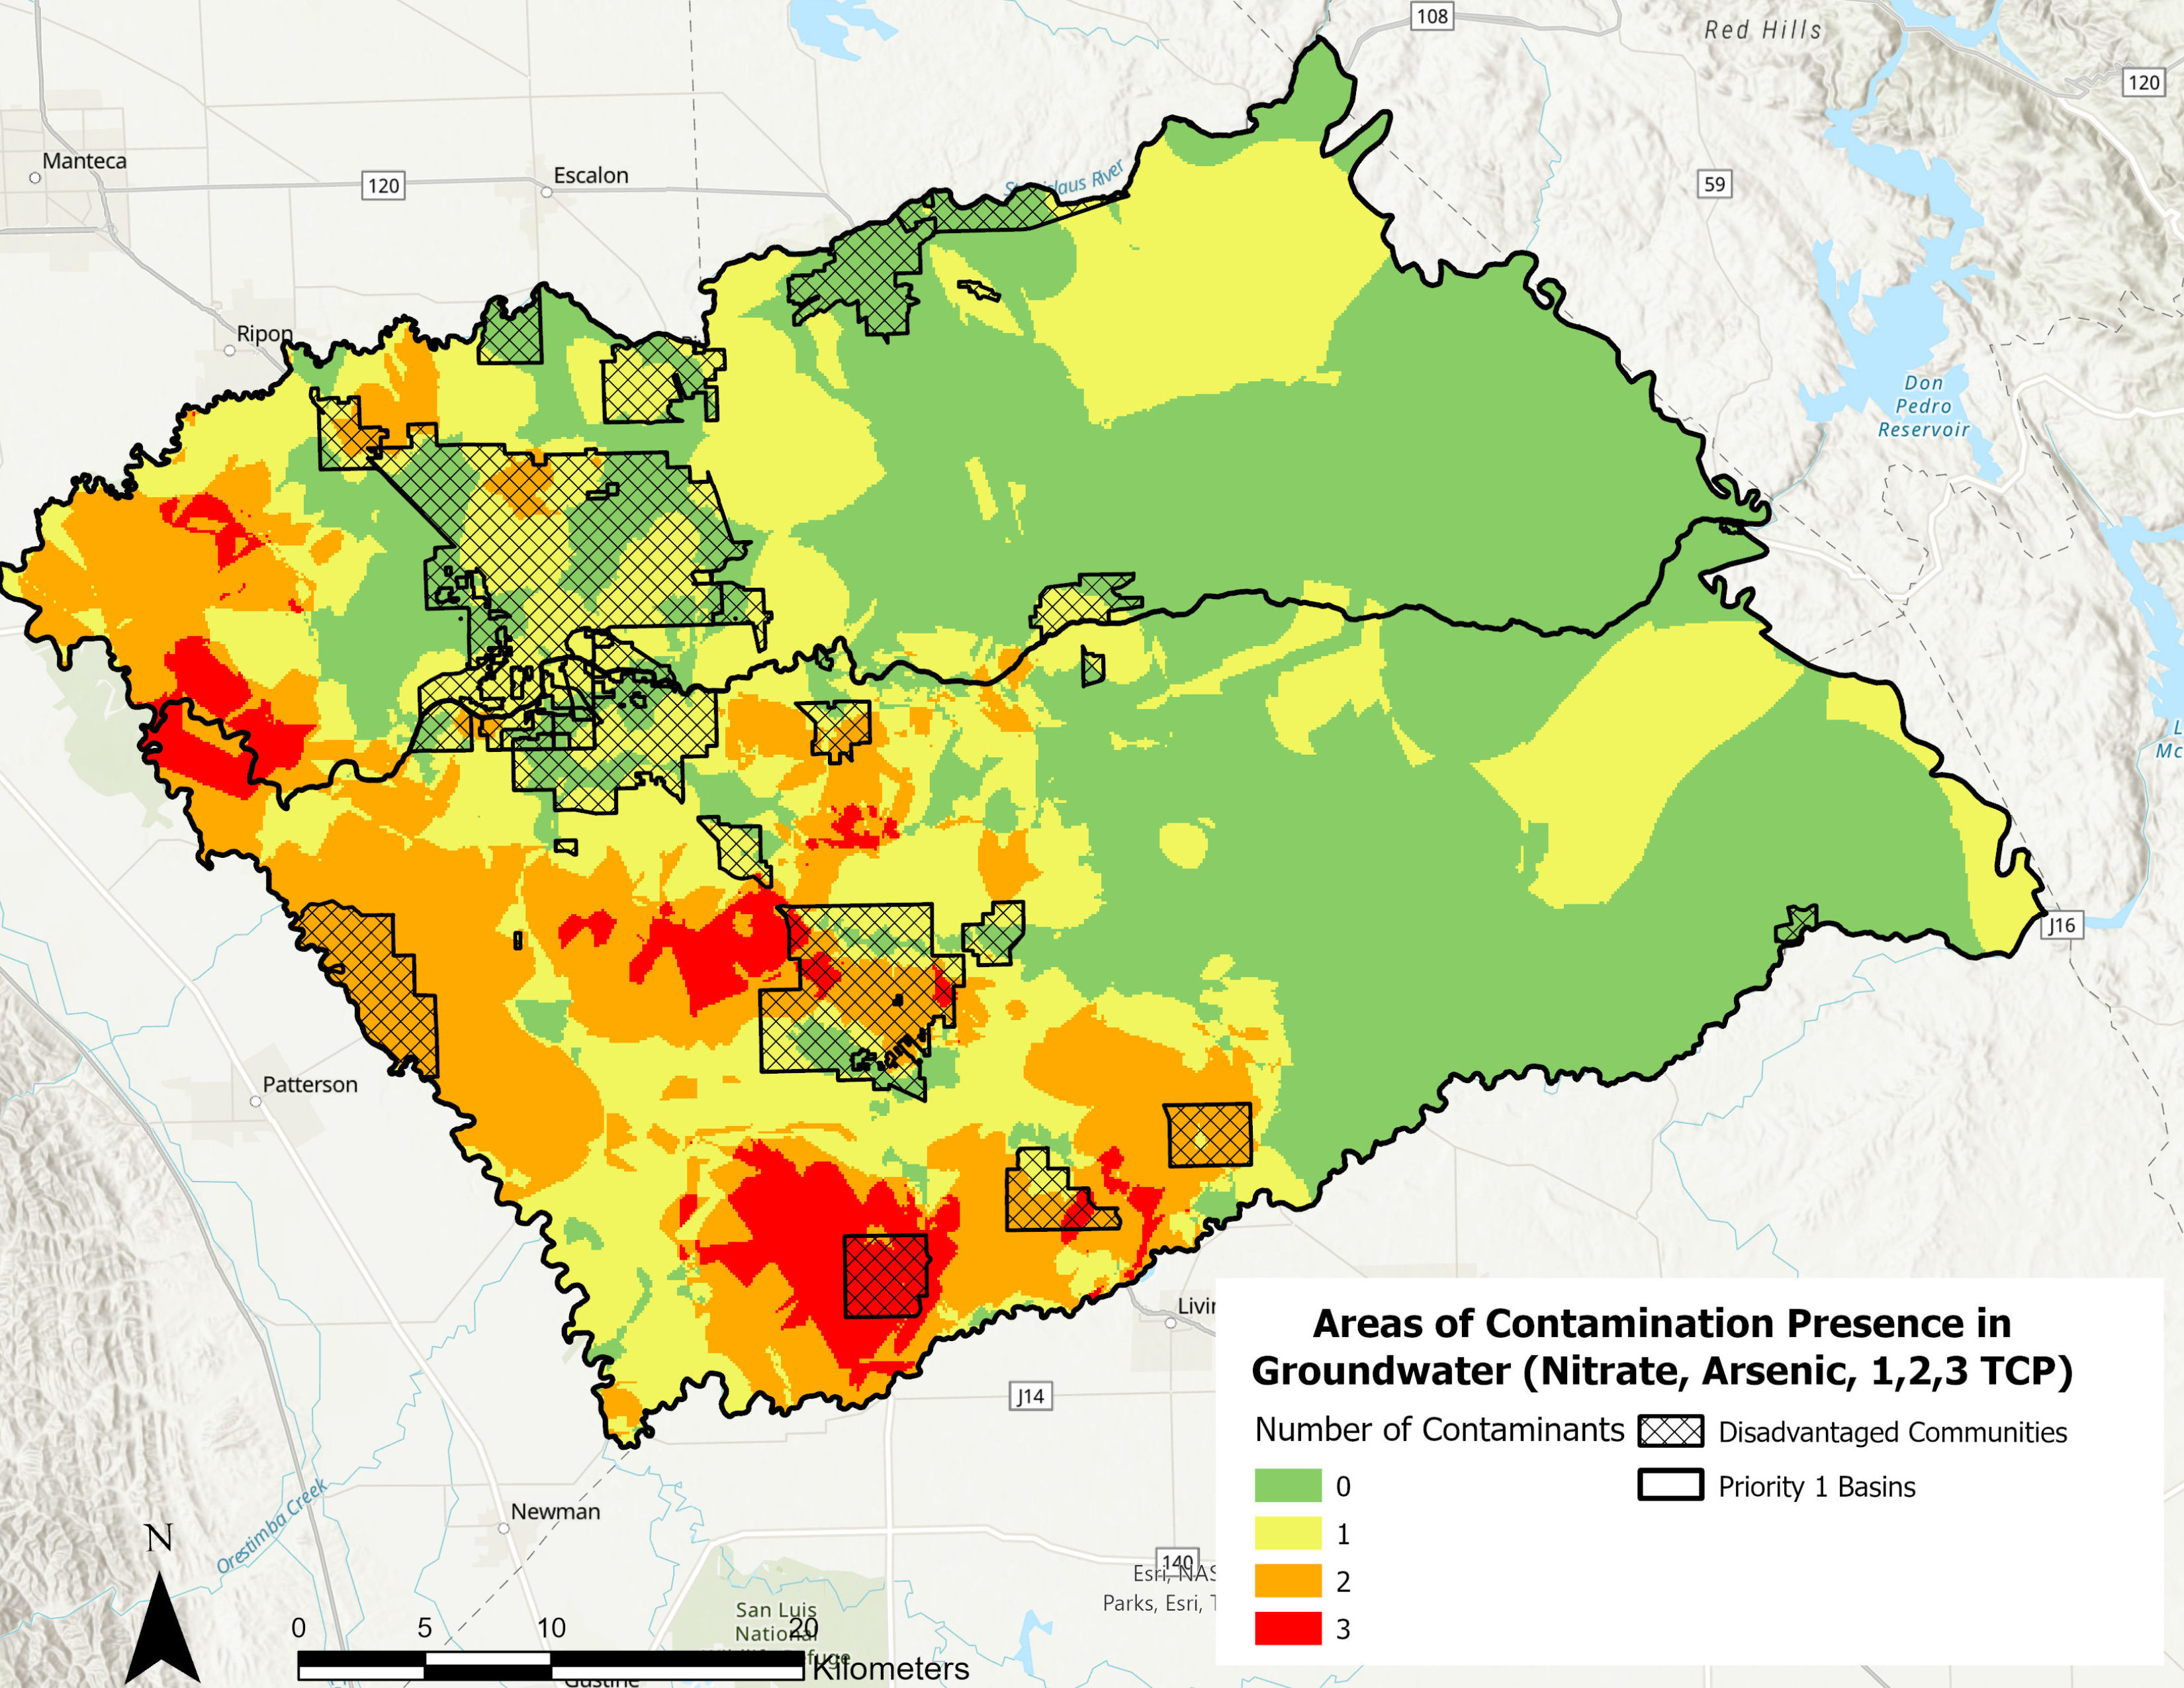
Distribution of Number of Groundwater Contaminants (Nitrate, Arsenic, 1,2,3 TCP) Present in Stanislaus and Merced Counties
The number of contaminants varied throughout the region of Stanislaus and Merced Counties. There were many locations (>12%) of the study area that had three groundwater contaminants above the MCL. The DAC of Hilmar's entire community has groundwater contaminants of Nitrate, Arsenic, and 1, 2, 3 TCP above the maximum contaminant level.
Figure by Jake Dialesandro, Iris Stewart-Frey, and Sarah Movahedi.
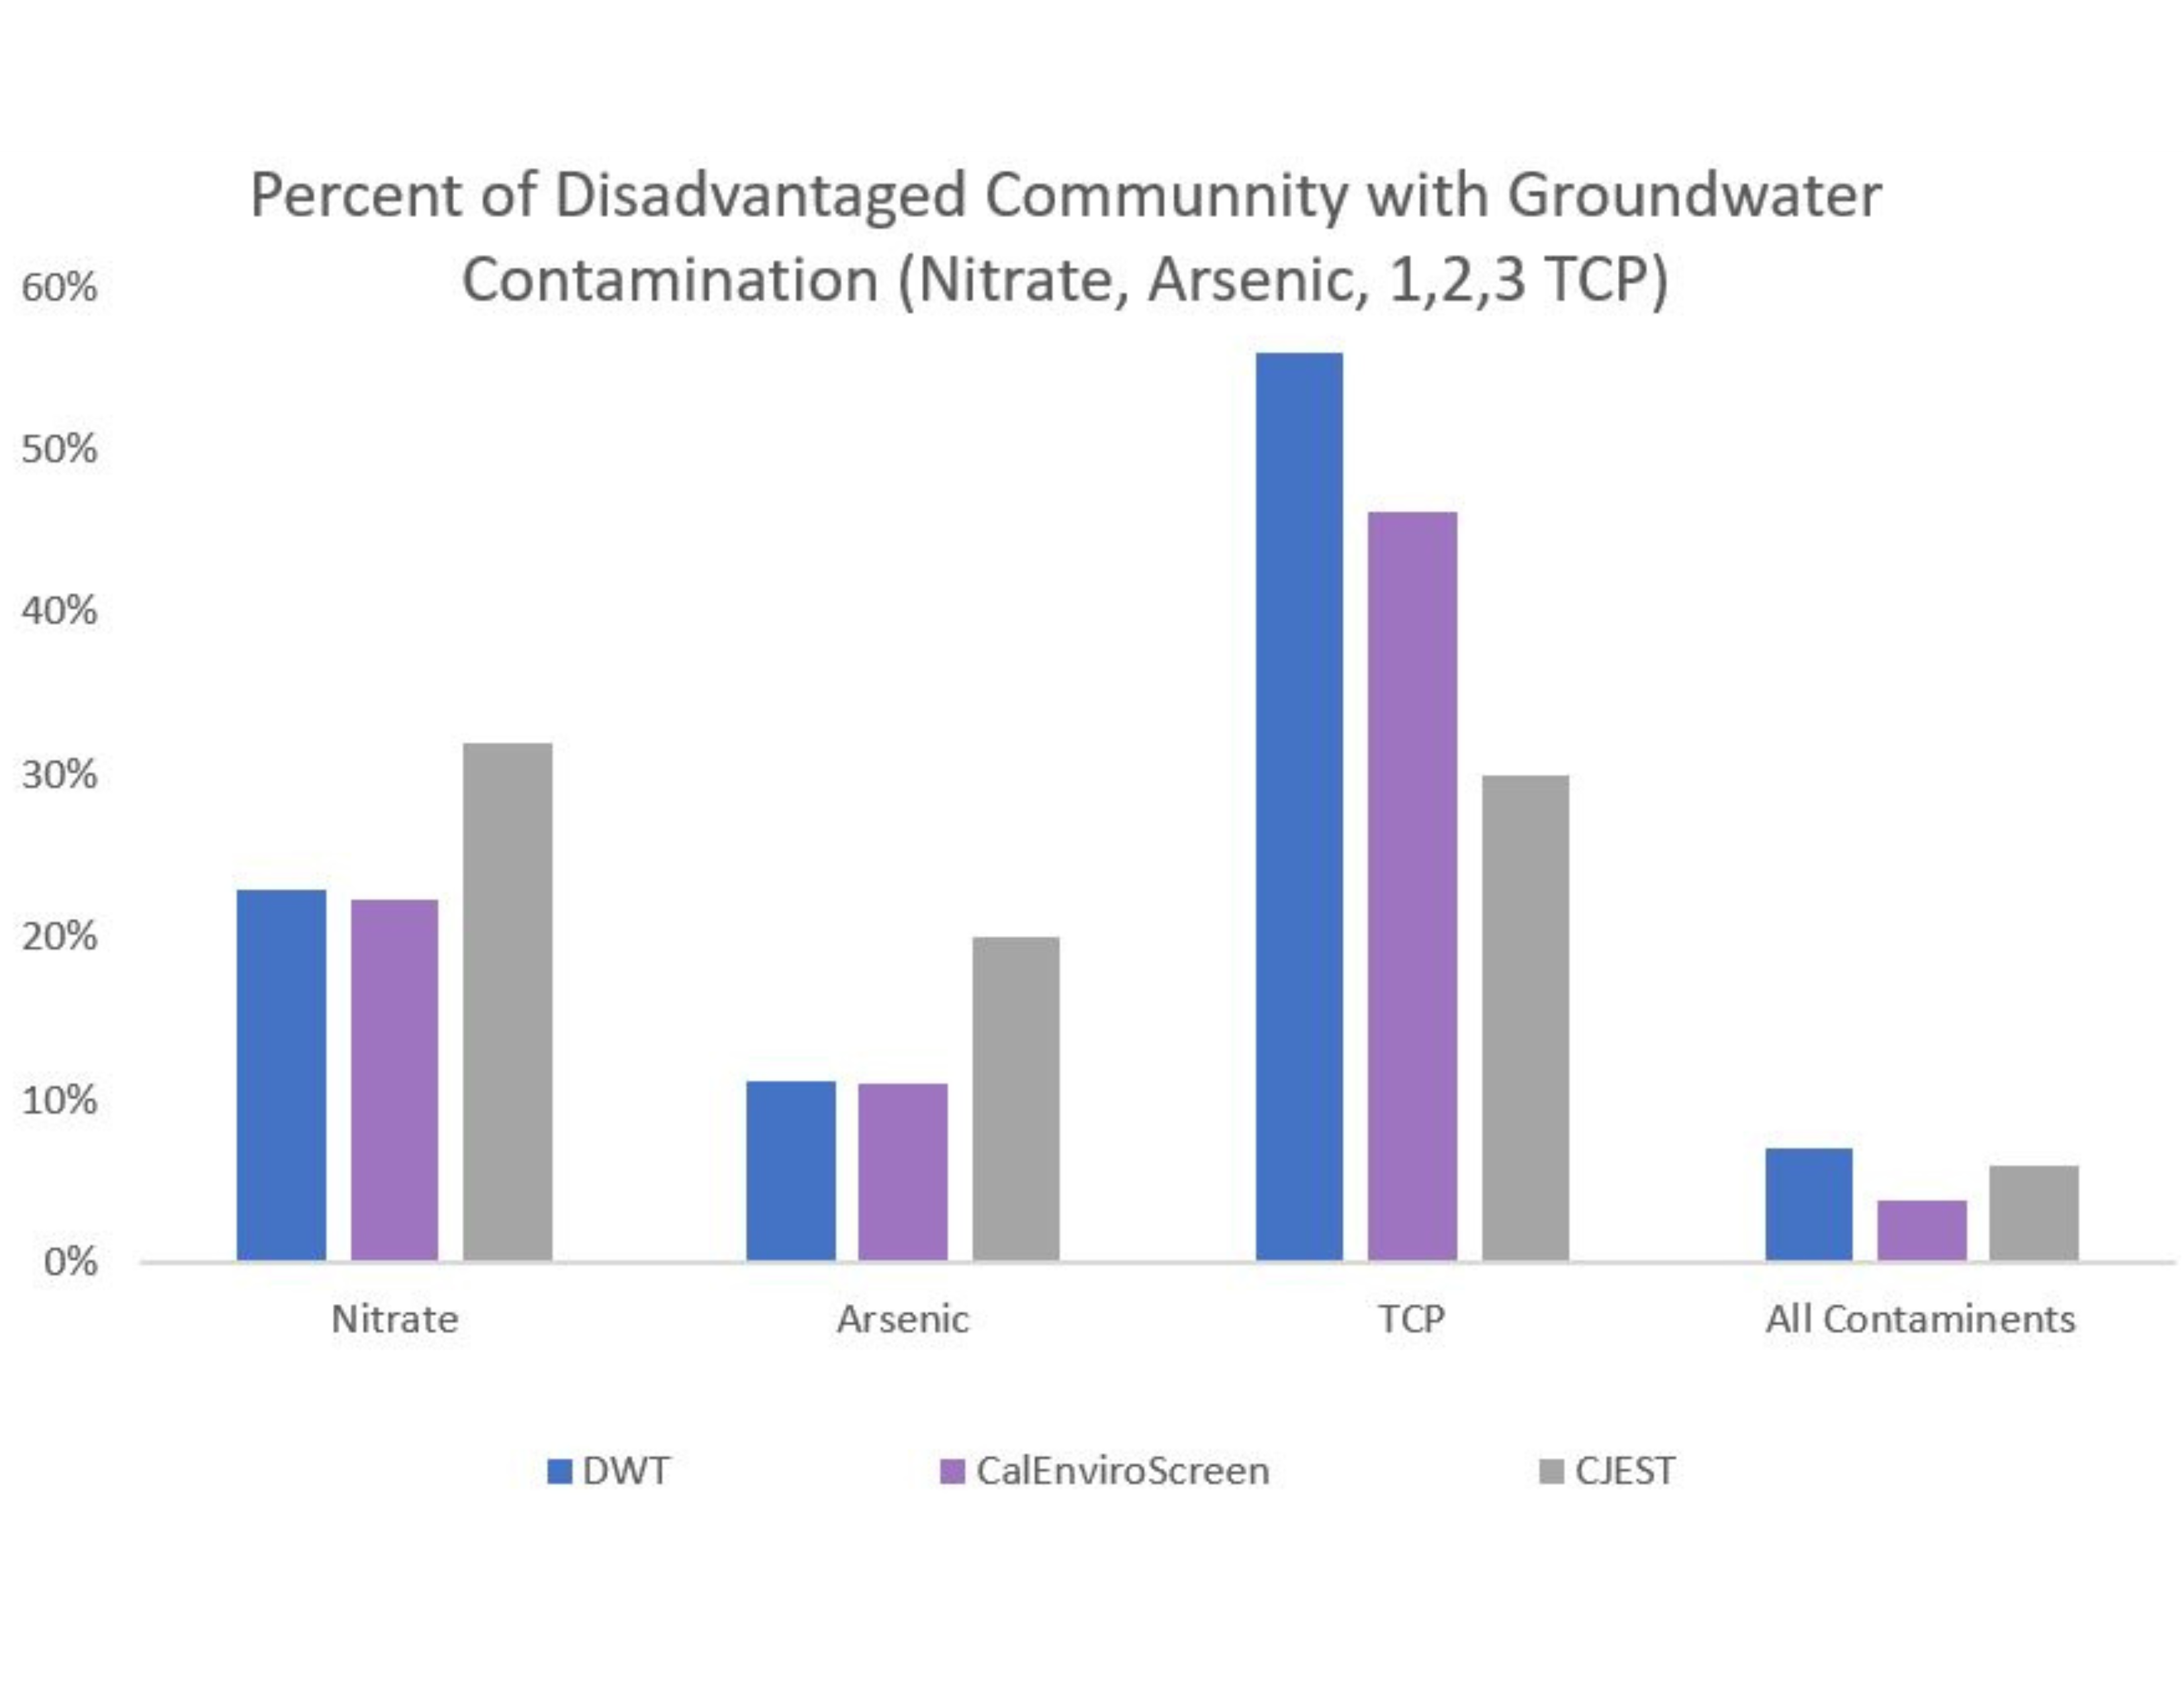
Proportion of Disadvantaged Communities Subject to Groundwater Contamination by Different Definitions of Disadvantaged
Disadvantaged communities by the Drinking Water Tool definition had the highest proportion of communities subject to groundwater contamination above the MCL. The Federal Climate and Economic Justice Tool recorded the highest proportion of disadvantaged communities subject to arsenic levels above the MCL. 1, 2, 3 TCP was the most widespread contamination with estimates of disadvantaged communities above the MCL between 45% and 55%.
Figure by Jake Dialesandro, Iris Stewart-Frey, and Sarah Movahedi.