Nitrate Contamination
Our Motivation
Manure from Concentrated Animal Feeding Operations (CAFO), fertilizer for agricultural crops, and waste from septic tanks all add nitrates to soils and groundwater. In many places throughout the Central Valley, intense agricultural practices add over 740,000 pounds of nitrogen from fertilizers, combined with the almost 200 million pounds of manure produced daily by CAFOs, and at times poor drainage and insufficient water from rain or irrigation have contributed to very high nitrate levels in the shallow groundwater. Nitrate levels near and above the Maximum Contaminant Level (MCL) of 10 mg/l set by the U.S. Environmental Protection Agency (EPA) have been linked to serious health impacts, such as blue baby syndrome in newborns, and bladder cancer. In communities that are not connected to public water systems, people often get all their water supplies from shallow wells which may be at risk for high levels of nitrate.
Variations in groundwater flow patterns, proximity to loading sources such as wastewater treatment locations, septic tanks, and CAFO operations, depth to groundwater, recharge through rain or irrigation, and other factors create variations in nitrate levels in both spaces (i.e. across the Central Valley) and over time. What communities, policymakers, and researchers would like to know is where nitrate levels are high and unsafe, how nitrate levels are changing over time, and how nitrate levels vary with factors such as drought and the seasons. Stanislaus and Merced County have been deemed to have particularly high nitrate based on the CV-SALTS program, and are deemed Priority 1 basins.
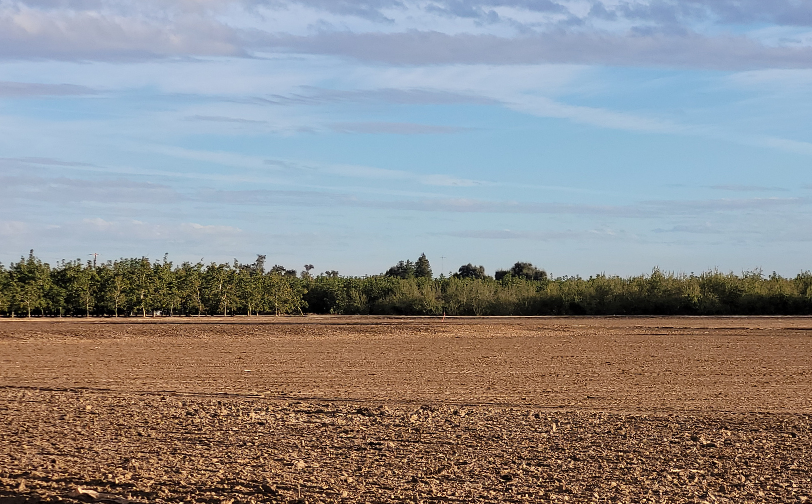
Central Valley agriculture in contrast to the drier surrounding landscape. Source: Getty Images.
Our Approach
We used Geographic Information Systems (GIS) to use information on nitrate contamination in adopting a geospatial approach that used nitrate concentrations in shallow domestic wells collected by various agencies within the state of California post-2000. We then used statistical techniques (interpolation algorithms) to estimate nitrate values in ambient groundwater between sampled locations - this process is very similar to how a weather map is created. Estimates of nitrates were produced for well readings from 2009 to the present day. We also analyzed trends of nitrate in domestic, municipal, and monitoring wells to investigate how nitrate levels have increased or decreased between 2000 and to present day. We also analyzed how nitrate levels can vary between seasons and between times of drought.
Our Results
Through our geospatial analysis, we found nitrate values above the MCL (or safe limit) to cover a vast majority of the western portion of the Modesto and Turlock Priority 1 Basin. Over 75 km2 of area within the Priority 1 Basin had ambient nitrate groundwater levels above 10 mg/l including many areas within disadvantaged communities. We also found a process that is currently underway called CV-SALTS to quantify nitrate contamination was underestimating the amount of area experiencing unsafe levels, omitting nearly 50 km2 of unsafe regions. Areas that were not included in the unsafe category included disadvantaged communities in Turlock, Delphi, Hilmar, and Hatch.
Our geospatial analysis also had a temporal component where we measured how nitrate levels varied within the season, as well as between times of drought and no drought. For measurements taken since 2000, we found nitrate levels in shallow domestic wells to vary widely across seasons, with some months not even having available data for measurements. Nitrate levels varied throughout the year, with some months averaging below the safe level, but other months averaging well above the safe limit. This, combined with many locations lacking any testing, contributes to the difficulty in locating unsafe groundwater locations. Our analysis also demonstrated that times of drought can increase nitrate levels at least within the priority 1 Basins of Modesto and Turlock. Statistical analysis showed that years during extreme drought had significantly higher Nitrate levels than years with no drought.
Lastly, we analyzed the wells that had enough data to measure if nitrate levels were increasing or decreasing. Less than 5% of wells had enough data collected after 2000 to make accurate trend measurements, and no domestic wells had enough collected data. Even fewer wells were able to be identified as significantly increasing or decreasing. The majority of wells in disadvantaged communities had a severe lack of consistent testing making trend analysis impossible.
Interactive Map of Nitrate in Modesto/Turlock Area
Interactive Map of Common Groundwater Contaminants in the Central Valley
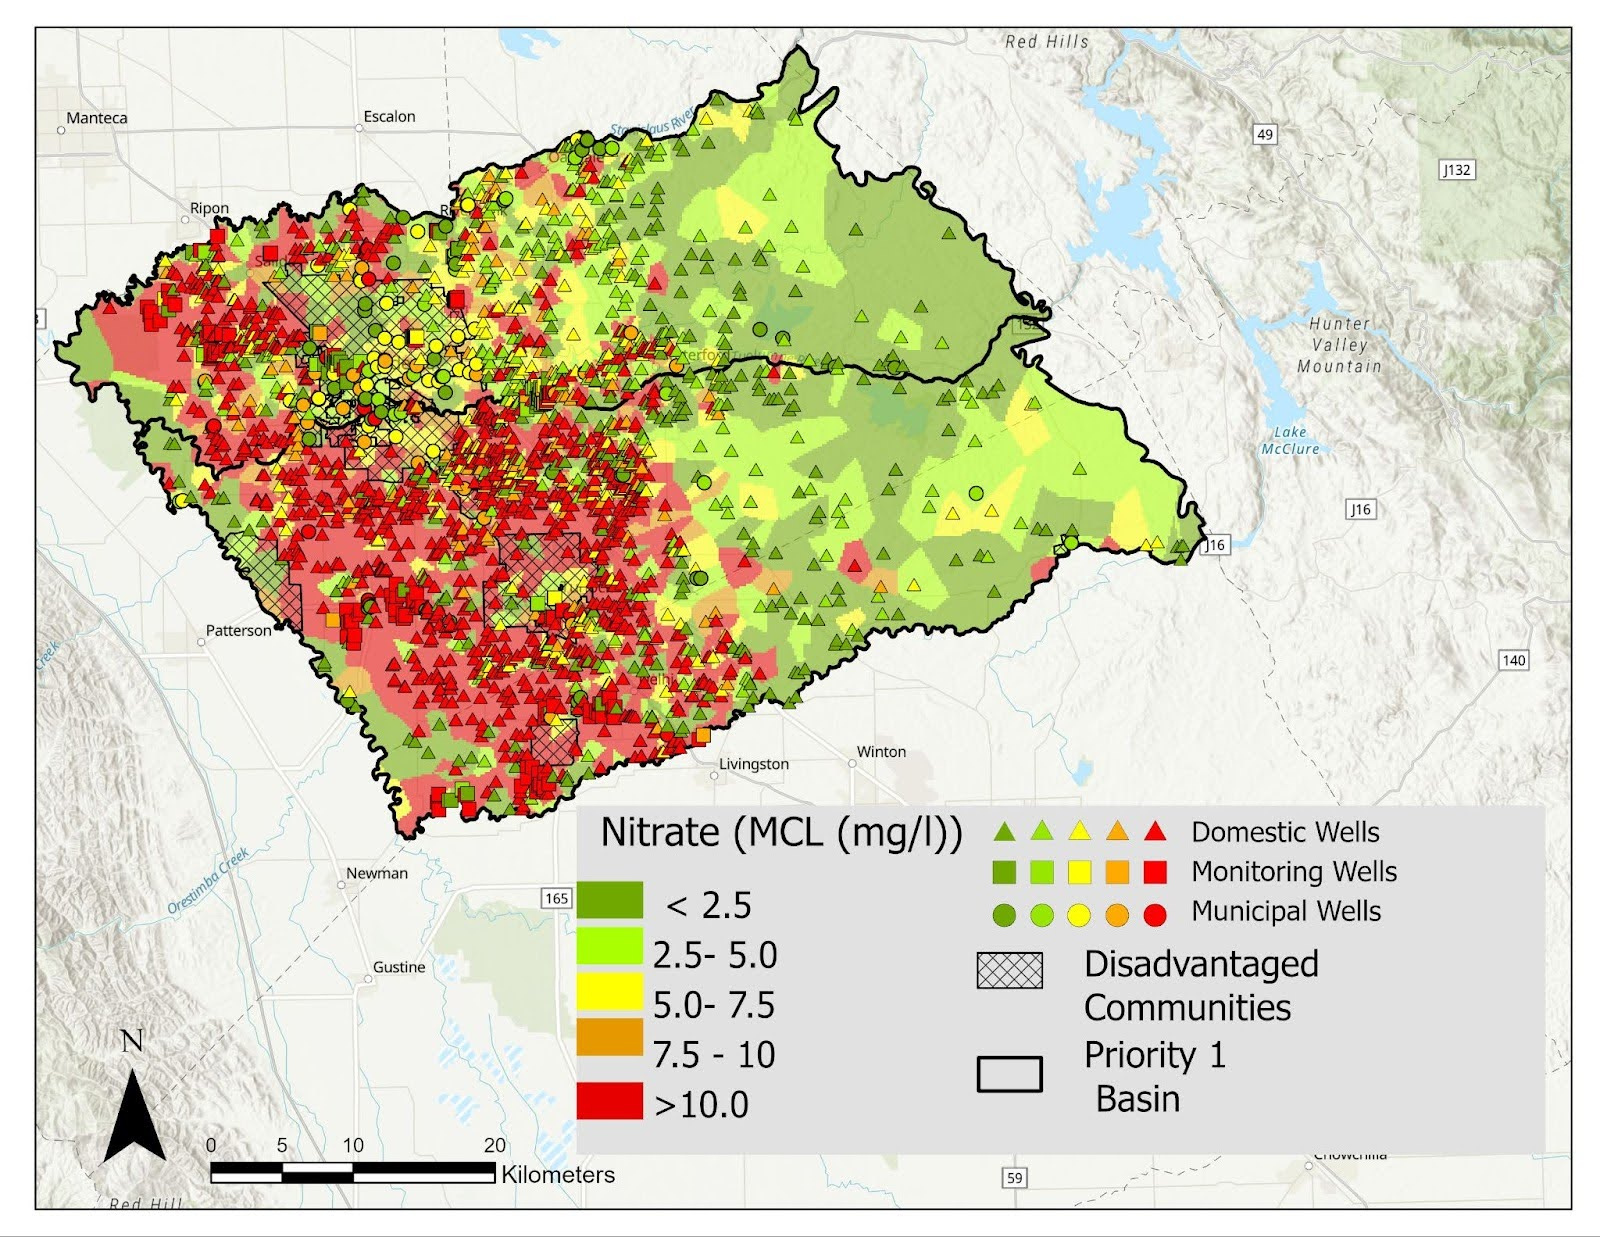
Nitrate Contamination throughout Stanislaus and Merced Counties 2010-2023
Interpolated Groundwater Nitrate Contamination in Stanislaus and Merced Counties are priority 1 basins for the CV-SALTS program. Together with nitrate concentrations in domestic, monitoring, and municipal wells and the location of disadvantaged communities. Widespread nitrate concentrations above safe levels are found in the southwestern area of Stanislaus and Merced counties, near disadvantaged communities.
Figure by Iris Stewart-Frey, Jake Dialesandro, and Lilah Foster.
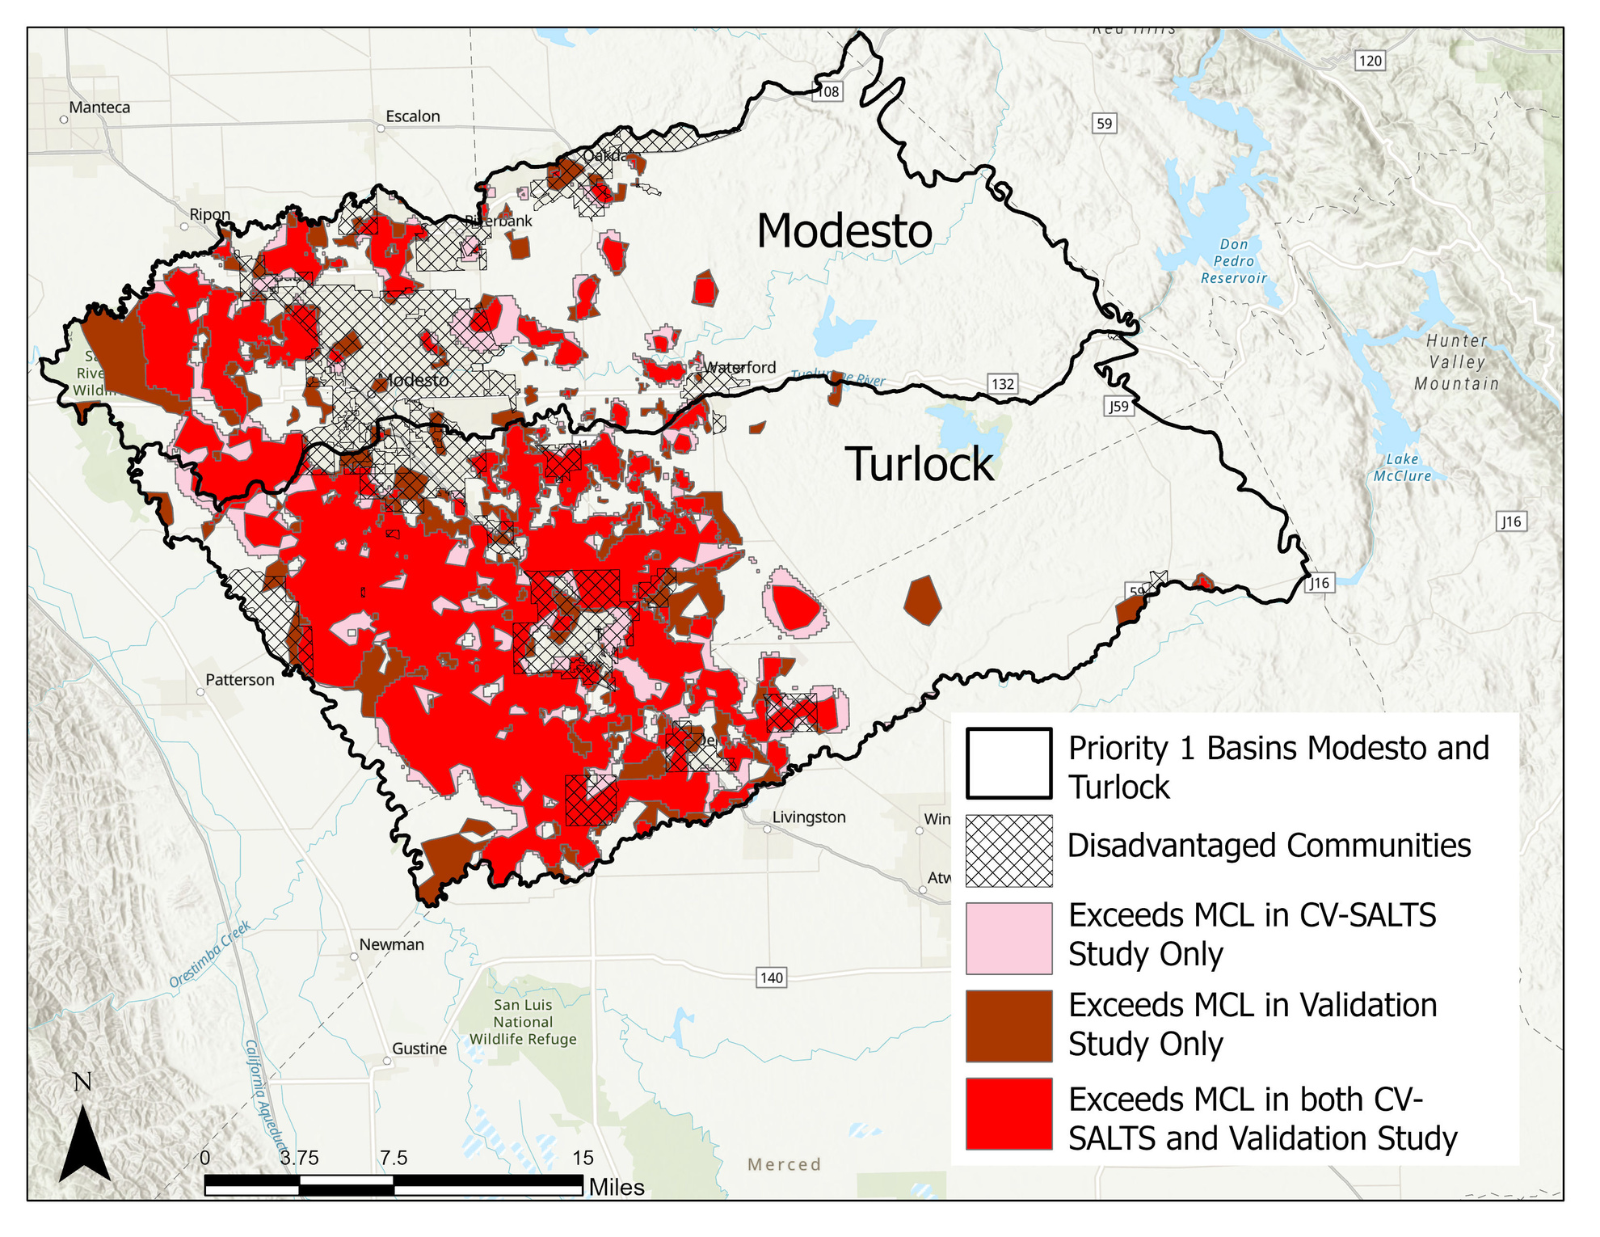
Validation Study of Where Nitrate Levels Would Be Above the MCL (Deemed Unsafe) Using the CV-SALTS Data
Nitrate levels are interpolated between actual measurements in wells - just like for a weather map. SCU findings show that there might be areas assessed as below the MCL (or safe) by the CV-SALTS process, which are actually not safe. Those areas are shown in dark brown in the figure.
Figure by Jake Dialesandro and Iris Stewart-Frey.

Monthly Mean Nitrate Concentrations in Domestic Wells in the Stanislaus and Merced Counties
Monthly mean nitrate domestic well concentrations from CV-SALTS data as measured between 2010 and 2023. The dashed line indicated the maximum contaminant level (MCL) or ‘safe level.’ Three months of the year were not sampled at all by any state agency and four months of the year (March, September, November, and December) averaged above the MCL. This result shows that it is important at what time of the year sampling for nitrate is conducted, and one should sample more frequently to avoid sampling only in months with lower nitrate concentrations.
Figure by Iris Stewart-Frey, Lilah Foster, and Jake Dialesandro.
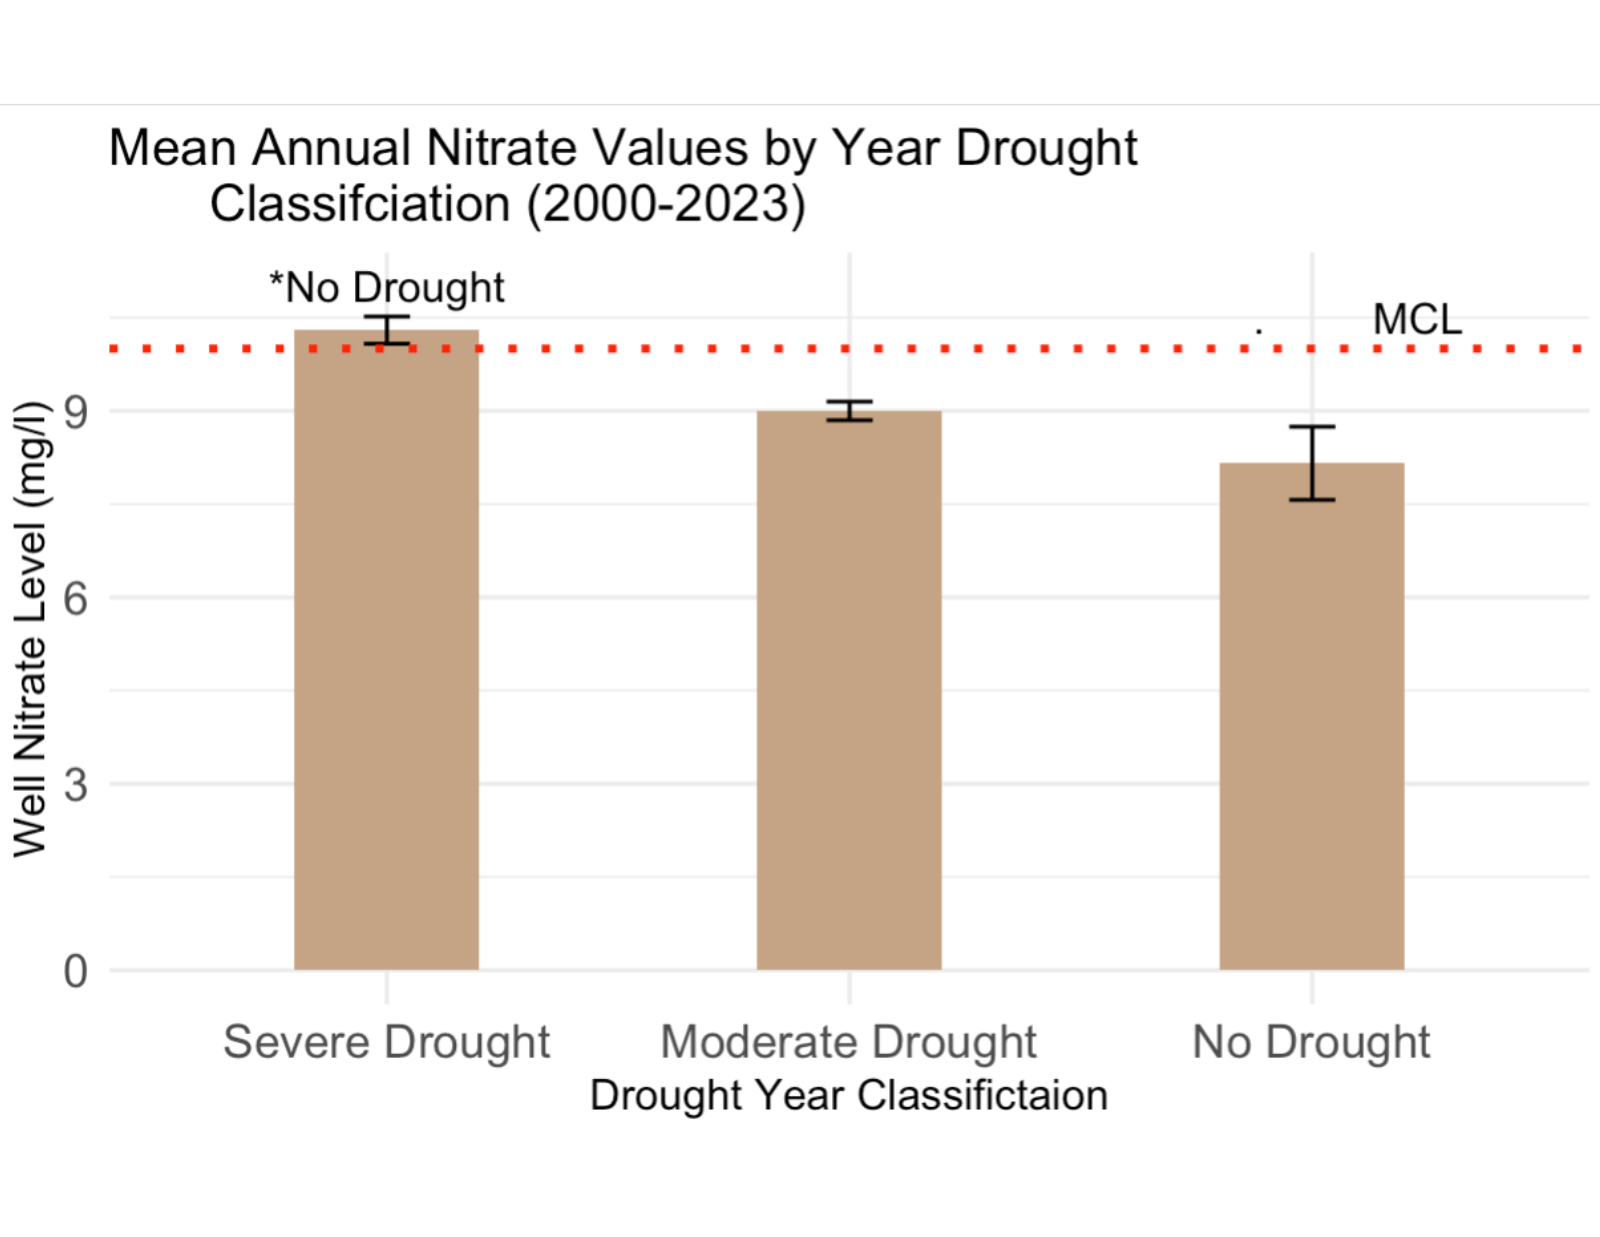
Comparison of Nitrate Values in Shallow Domestic Wells between Years of Severe Drought, Moderate Drought, and No Drought
Shallow domestic wells had significantly higher nitrate concentrations during severe drought than years of no drought. The red line indicates the MCL or ‘safe’ level. During a severe drought communities depending on shallow wells are highly likely to be affected not only by wells drying up but also by higher nitrate concentrations.
Figure by Iris Stewart-Frey and Jake Dialesandro.
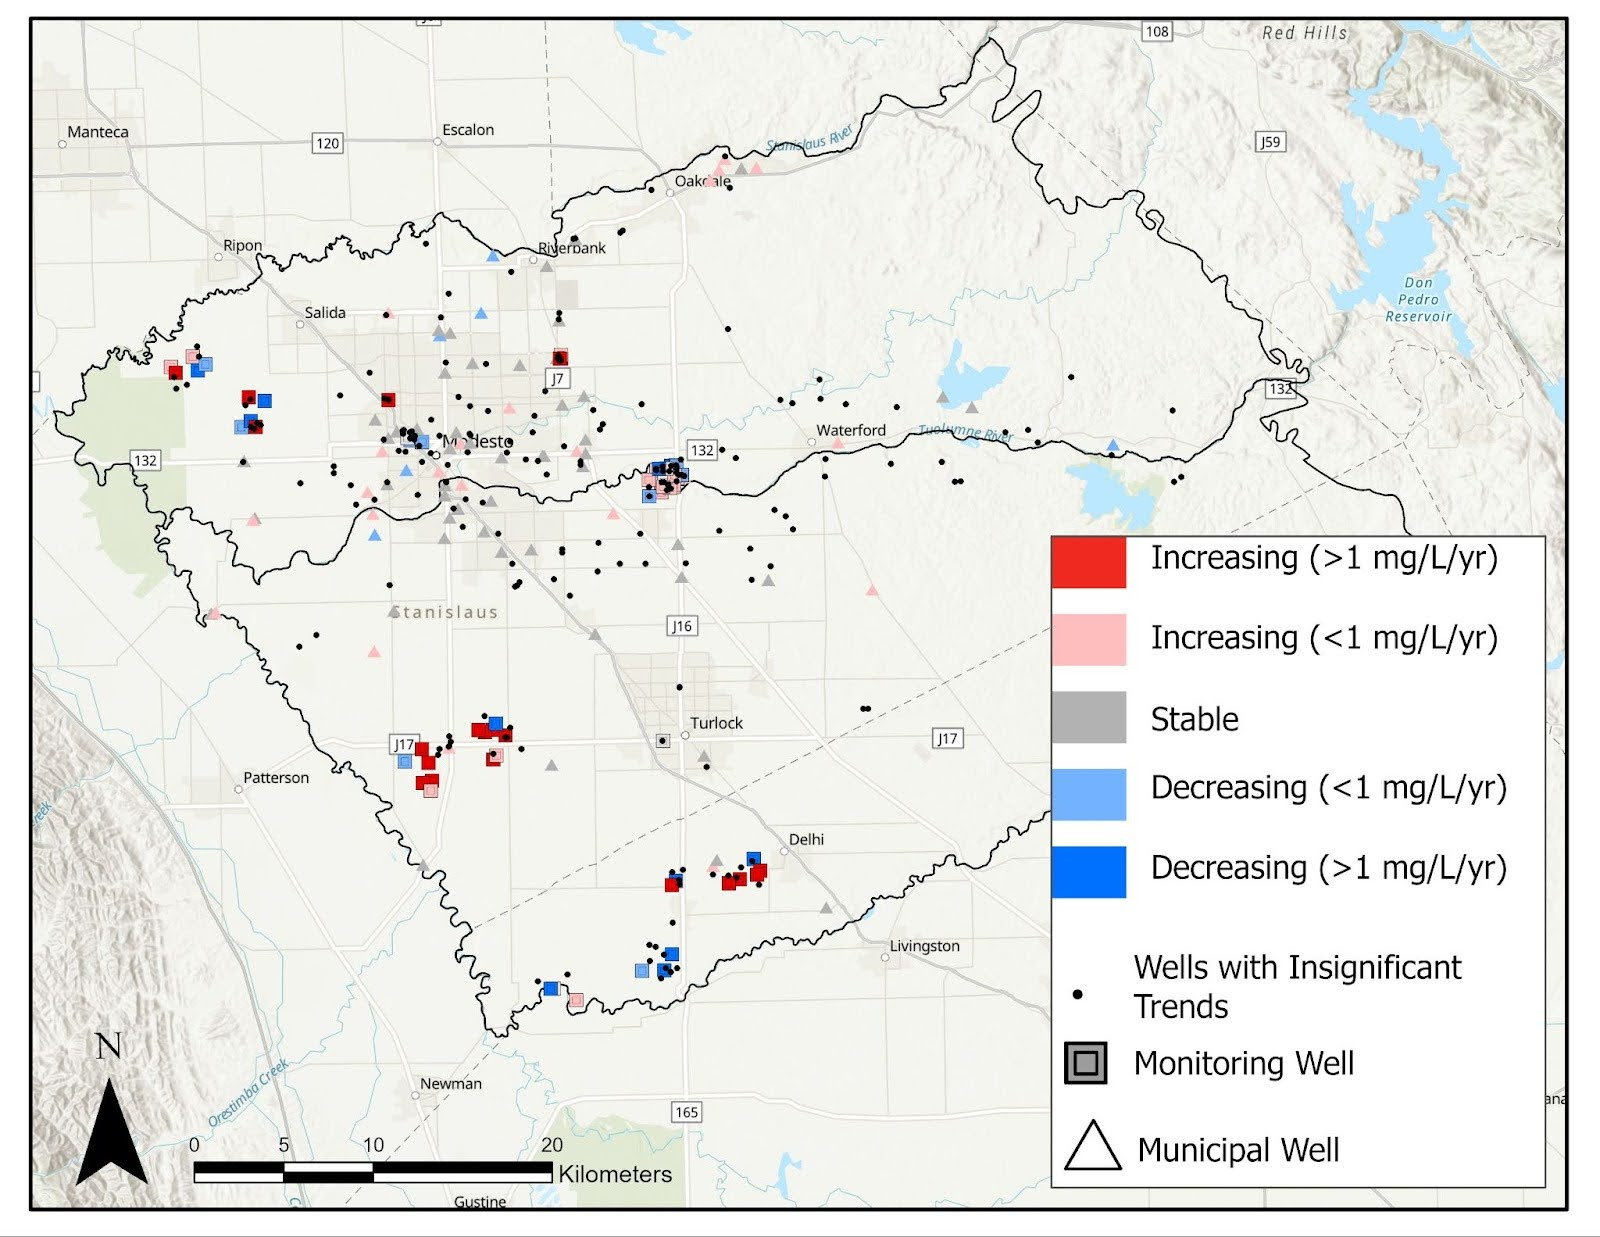
Trends in Well Nitrate Concentrations throughout Stanislaus and Merced Counties
Less than 5% of wells had enough data to calculate trends, and none of these were domestic wells. Thus, changes in nitrate levels in drinking water wells in Stanislaus and Modesto Counties cannot be known. As gleaned from monitoring and municipal wells, which tend to be deeper, nitrate levels are significantly increasing in several locations throughout the western and southern portions of Stanislaus and Merced Counties.
Figure by Iris Stewart-Frey and Jake Dialesandro.